
1.2 States of matter
Substances generally exist in one of three different states: as a gas, liquid or solid. Figure 3 illustrates these states in terms of their atomic arrangements. Atoms or molecules in a gas move at high velocities, and the distances between them are large, so gases have low densities. In a liquid, the atomic motions are slower, and the atoms are closer together (producing a higher density). If you could take a snapshot of the atoms in a liquid or a gas, you would see a random or disordered arrangement. Another snapshot, taken a fraction of a second later, would look different. So, the internal structures of liquids and gases are disordered both in space and time.
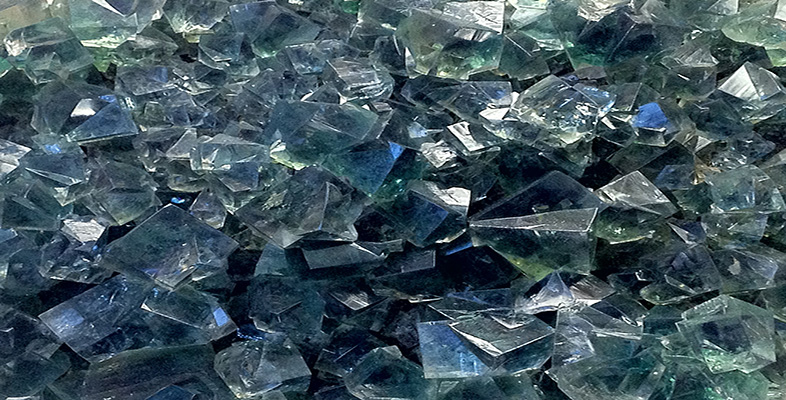
A kind of real-life snapshot of a liquid structure can be taken by very rapidly cooling the liquid to quench it, so that it solidifies before the atoms have had time to rearrange themselves. At low temperatures, there is not enough thermal energy for the atoms to move relative to each other. The quenched material is a disordered solid, known as an amorphous solid or glass (Figure 3).
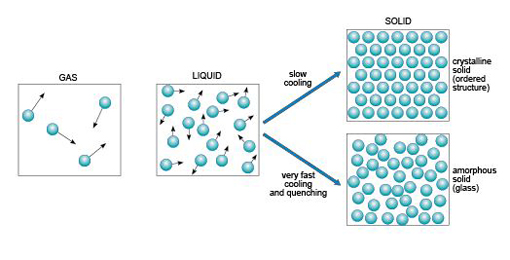
By contrast, slow cooling of a liquid allows atoms to arrange themselves into an ordered pattern, which may extend over a huge number of atoms. This kind of solid is called crystalline. So if a melt of a given composition (e.g. SiO2) is cooled very rapidly it will produce a silica glass, whereas if it were cooled slowly it would produce a crystalline solid composed of quartz crystals.
It is important to note that compared with crystalline solids, glass is not a particularly stable form of matter. Over many years, glass may slowly convert into a crystalline form in a process called devitrification, and this can sometimes be observed in centuries-old window panes, where circular frosted patches of tiny crystals have formed within the glass.
The states in which a single substance can exist - gas, liquid or solid - are referred to as phases of matter. The range of pressures and temperatures over which a particular phase is stable (i.e. its stability field) can be shown on a phase diagram. The stability fields of different phases may be represented as areas separated by boundary lines on a pressure-temperature diagram, as illustrated in Figure 4, a phase diagram for H2O. A change of temperature (or pressure) may result in a phase transformation; for example, liquid H2O (water) can be heated to form a gas (steam), or cooled to form a solid (ice).

At the surface of the Earth, with a typical pressure of one atmosphere (approximately 105 Pa), a crystalline solid, ice, is the stable phase of H2O at temperatures below 0 °C. Above this temperature (the melting point of ice), solid ice transforms to liquid water. The boundary between the solid and liquid stability fields is a phase boundary, and is indicated by a solid line in Figure 4. If the temperature continues to increase at constant pressure (along the horizontal dashed line in Figure 4), the phase boundary between the liquid (water) stability field and the gas (steam) stability field is reached. This boundary represents the boiling temperature of water. Although only the effect of changing temperature has been considered so far, it is important to note that both the melting temperature and the boiling temperature vary with pressure. The point where all three phase boundaries for H2O meet is called the triple point, a unique pressure and temperature where solid (ice), gas (steam) and liquid (water) can coexist.
-
How would the boiling temperature of water, measured at the top of a high mountain where the atmospheric pressure is much lower, compare with its boiling temperature at sea level?
-
The H2O phase diagram (Figure 4) shows that the boiling temperature of water (indicated by the liquid/gas phase boundary) decreases with decreasing pressure. Thus, on top of a mountain, where atmospheric pressure is lower, water boils at a lower temperature.