
1.2 Measuring brightness
In this section so far you’ve encountered several astronomical quantities associated with the brightness of objects: specifically, apparent and absolute magnitude, flux, and luminosity. Importantly, the brightness we measure from an image does not, on its own, tell us anything about the physics of the star or galaxy. Until we know how far away it is, we are only measuring how bright it looks to us on the sky. Sometimes we can make beautiful images of the sky from which it is quite difficult to draw conclusions about the science of what we’re looking at, because it is not possible to measure accurate distances.
In principle it is easy to measure the apparent magnitude – or flux received – from an astronomical object in an image:
- first, identify which pixels in the image correspond to the object of interest
- then, sum up the brightness measured in each pixel.
Figure 3 shows two images with photometric apertures drawn on them. These are regions (defined by the astronomer analysing the image) within which the brightness of each individual pixel is added together. The sum of the brightness of each pixel within the circular aperture is the total brightness for each star or galaxy.
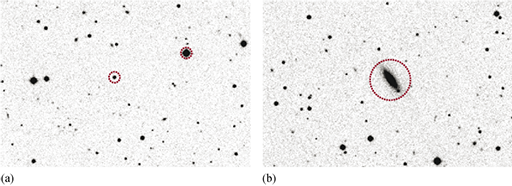
It is not necessarily straightforward to decide how big to make the aperture. The blurring effects of the atmosphere and telescope optics, and the underlying shape of the light distribution from large objects such as galaxies, mean that defining the aperture size can be tricky. A large aperture will include a greater proportion of the source flux, but may also suffer from higher contamination from the surrounding background flux (the grey ‘noise’ between the darker stars and galaxies in Figure 3).
Figure 4a shows how the surface brightness of a star (its flux or magnitude per unit area) is measured to decrease with distance from its centre. Such plots can be referred to as radial surface brightness profiles. The light is spread out over a number of pixels, despite the true angular size of the star being smaller than one image pixel. The way that light from a star is distributed across multiple pixels by a particular telescope is known as the telescope’s point-spread function (PSF).
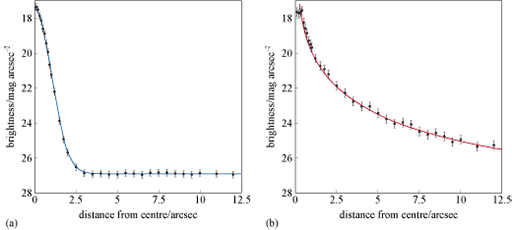
Figure 4b shows the radial surface brightness profile for a galaxy. To make these graphs, the surface brightness is measured in circular ‘annuli’ (rings) centred on the source. Such profiles for bright stars in the field can be used to determine the shape of the PSF for your observation – in other words, they enable careful measurement of the degree to which the light emitted by the star is being blurred across a wider area in the image we see. This allows aperture sizes to be chosen that optimise the quality of the measurements.
For sources whose true angular size is larger than a single image pixel, such as the galaxy in Figure 4b, the radial brightness profile is broader than the PSF, and follows a characteristic shape based on the distribution of stars. Model galaxy profiles can be used to help determine the best aperture size, and/or correct for missing flux beyond the chosen aperture radius.