
3.1 Broadband images
To compare astronomical measurements of brightness for different objects reliably, and to make physical interpretations (e.g. estimate the temperature of stars, understand the effect of dust obscuring our measurements), we require precise information about the range of wavelengths of light that are recorded in an image. Telescope filters provide us with a way to do this.
By using a filter that only allows red light – from a specific range of wavelengths – to pass through, brightness and colour information can be recorded in a standardised way. Other astronomers will be able to reproduce exactly the same observation, and should measure the same amount of red light from the same object (unless it is variable).
The standard optical U, B, V, R and I filters are referred to as ‘broadband filters’, although they typically encompass considerably narrower wavelengths than broadband spectra. Each of these filters spans a wavelength range of a few hundred nanometres. The U filter passes light in the near-ultraviolet (near-UV) range of the spectrum; the B filter passes blue light; the V filter passes green–yellow light; the R filter passes red light, and the I filter passes light in the near-infrared (near-IR) part of the spectrum.
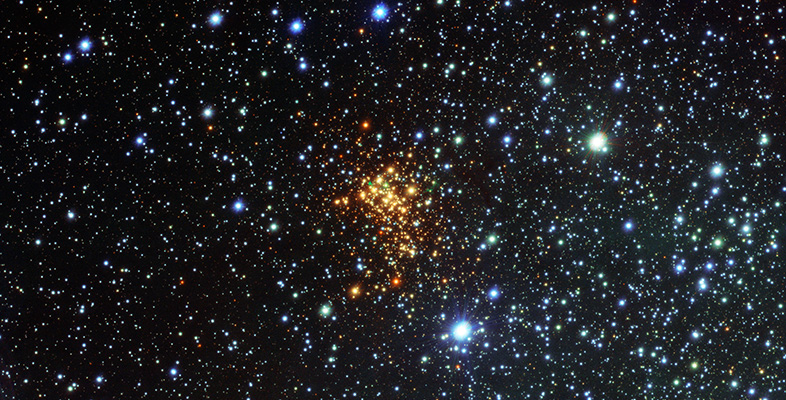
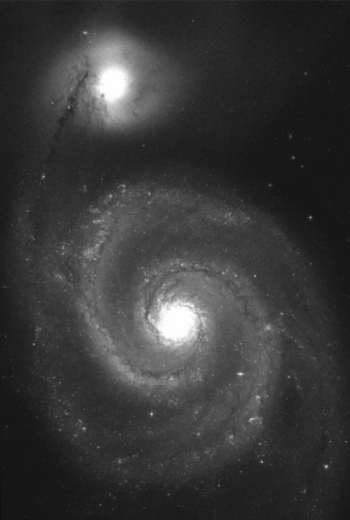
Most of the astronomical images we see in news stories, press releases, and astrophotography exhibitions are in colour, but it is important to emphasise that these rarely represent exactly what our eyes would see (if they were as sensitive as a telescope). Colour images are usually made by combining together images taken in three, or sometimes more, different filters. Each image on its own is simply a record of the brightness in each pixel, so might best be represented by a greyscale image.
Video 1 initially shows such a greyscale image from one filter. The images recorded through three different filters are then assigned (typically) red, green and blue colour ranges, and then added together to form a multicolour image that shows which parts of the object have redder or bluer light.
But telescope filters typically do not match the response of our eyes to light very closely, and various decisions need to be taken in combining different filters together. So there is no single ‘right answer’ to the question ‘what does this astronomical object look like in colour?’
Colour images are useful visualisations to help understand the structure of objects, but if we want to draw scientific conclusions from them it’s important to keep a careful record of the properties of the telescope filters and how the images were combined together.
Quantitative measurements of colour involve taking the difference in brightness as measured by two different filters (e.g. ()). Colour index is measured by doing photometry (recall Section 1.2 of this course) separately on images from two filters and then subtracting the magnitudes.
-
If working with colour indices, why is it essential to use standard telescope filters with known wavelength ranges?
-
As with comparing brightness measurements of stars or galaxies, it is only possible to make reliable comparisons between colour measurements for different astronomical objects and/or measurements taken with different telescopes if exactly the same ranges of light are being compared.