
4.2 Surveying beyond the Milky Way
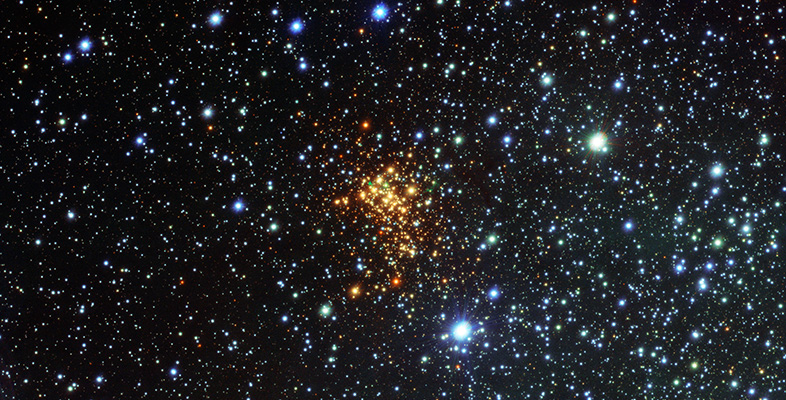
The Milky Way spans a large region of the night sky, but the Milky Way images explored in the previous section are not the only type of ‘wide-area’ sky images we can examine.
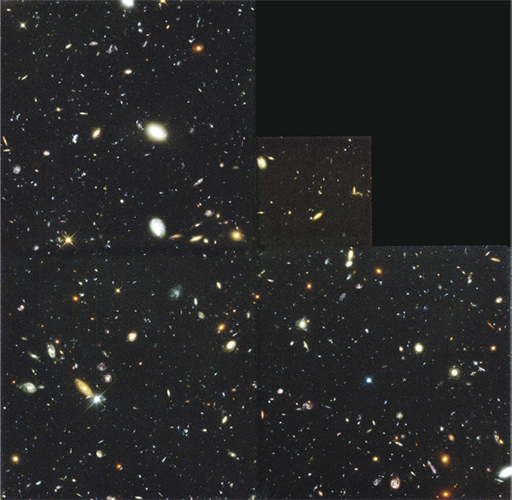
Deep images of areas of sky away from the path of the Milky Way (often referred to as the ‘extragalactic’ sky) reveal very large numbers of galaxies beyond our own. Figure 15 shows a single deep galaxy image, which is roughly 2.6 arcmin on each side, or around one-tenth of the angular size of the full Moon.
Astronomers have also undertaken enormous efforts to map out the locations of galaxies across larger areas of the sky, as well as the three-dimensional neighbourhoods and environments of galaxies. Galaxy surveys compile together thousands of individual images to map large areas of sky. An example is shown in Figure 16, where around 60 000 images of the Northern and Southern Hemispheres have been combined to produce a map that charts the positions of millions of galaxies.
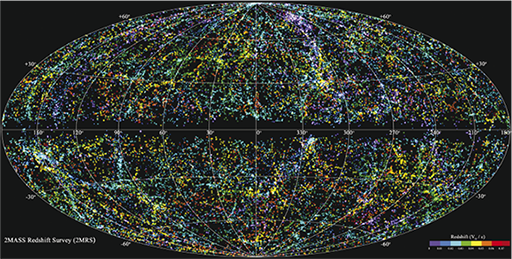
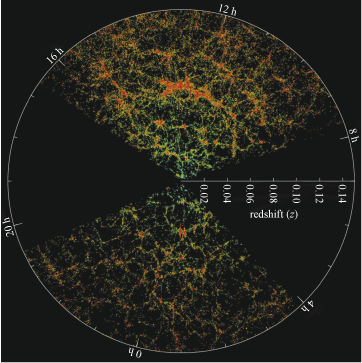
Figure 17 shows an even more zoomed-out region of a galaxy survey, projected using redshift information to form a three-dimensional map. The radial coordinate is redshift – so the centre of the diagram is nearby and the outer parts more distant – while the angular coordinate is right ascension. Each dot is an entire galaxy, containing hundreds of billions of stars!
-
What do you notice about the way that galaxies are distributed on the sky? Is the structure random?
-
The distribution of galaxies is not random. There are bright clumps where large numbers of galaxies cluster together – for example in a band running approximately from 11 h to 14 h of RA at a redshift of 0.06 – and emptier gaps in between them.
Together the locations of these galaxies form a map of what is known as the cosmic web. The brightest points in the web are galaxy clusters, where many galaxies cluster together. These brighter regions are connected together by filaments, and void regions where there are far fewer galaxies.
The ‘large-scale structure’ of the Universe, this cosmic web visible in Figures 16 and 17, is a consequence of the influence of gravity. Evidence suggests that galaxies and larger structures are built up over the history of the Universe, with smaller clumps being pulled together by gravity to form larger ones.
Astronomers have carried out many different surveys, which have investigated different parts of the Universe. In the following activity you will compare two important recent galaxy surveys.
Activity 4 Comparing astronomy surveys
Figure 18 shows the distribution of galaxies in terms of:
- their position on the sky
- their distance from Earth.
The plotted data are taken from two modern galaxy surveys – the Hubble Deep Field (HDF, shown in Figure 15), and the Sloan Digital Sky Survey (SDSS) – together with the galaxies included in Edwin Hubble’s famous 1929 paper that demonstrated what we now know as the Hubble–Lemaître law (the relationship between distance and recession speed: redshift).
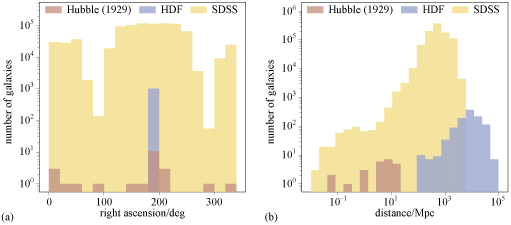
Examine the two graphs, and answer the following questions to compare what we can learn from different types of galaxy survey.
a. The SDSS is a wide-area sky survey. With reference to the two plots, can you suggest some advantages of wide-area surveys?
Discussion
By surveying a large area of sky (see the wide range in right ascension shown in panel (a)), the total number of galaxies included is very large. This means that the survey is likely to include examples of rare or unusual galaxies, and is also less affected by any biases due to the structure that might be present in one particular sky direction (see, for example, the uneven distribution of galaxies in Figure 16).
b. The HDF is a deep-sky survey, which is very sensitive to faint objects. With reference to the two plots, what do you think is the main advantage of a deep-sky survey?
Discussion
The sensitivity of such surveys to faint objects means that it is possible to include galaxies at much larger distances (compare the upper boundary of distances for the HDF data to that of the other two surveys in (b)). This is useful for studying how galaxies evolve.
c. Once more with reference to the two graphs, can you think of any limitations of wide-area sky surveys, such as SDSS, that it might be important to consider when analysing their results?
Discussion
Wide-area surveys cannot usually observe galaxies to distances as large as single deep images (again, see the differences in the data returned by the various surveys in (b)).
Going beyond the data in the figure, on a more practical level, such surveys are made up of many individual telescope observations, and therefore require a lot of telescope observing time. This means that they take a long time to complete. They also require a large amount of scientific processing and analysis work to produce large catalogues of galaxy information – they are ‘big data’ projects.
d. Finally, in light of these graphs, can you think of any limitations of deep-sky surveys, such as the HDF, that it might be important to consider in analysing their results?
Discussion
A deep image of a small patch of sky – for example, the narrow range of right ascension of the HDF data shown in Figure 18a – may not be representative of the overall properties of the Universe. As an example, the number of galaxies per square degree will depend on which part of the cosmic web is being looked at: a deep image of a void, a cluster or a filament would give quite different results.
In contrast, overall numbers inferred from a wide-area survey like SDSS will provide a better big-picture ‘overview’ of the contents and structure of the Universe, although out to smaller distances.