

4.1 Skill 1: Create a dot-to-dot tile
In this skill, you will be creating your own tile design by drawing it on graph paper and then transferring it into p5.js code. If you don’t have any graph paper, you can just use a blank piece of paper and draw a small grid for this exercise.
Many of you may be familiar with dot-to-dot puzzles (Figure 14). The goal is to draw a line connecting the dots to reveal an image. You will be using a similar method to create your own decorative shapes, which will fit on a square tile.

You are going to use the same principles as a dot-to-dot drawing to help you create unusual digital shapes.
It would be helpful if you start by drawing your shape on paper, and then you are going to transfer it into a dot-to-dot tile-maker program. Video 7 shows you how this works.
Transcript: Video 7 Transferring a shape to the dot-to-dot tile maker
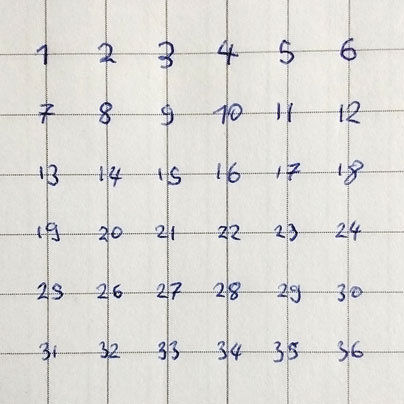
Start by getting a piece of graph paper and creating a 5 × 5 grid. Next, number every intersection, where the horizontal and vertical lines cross, from 1 to 36, with the number sequences going from left to right. On a 5 × 5 grid, there will be six intersection points on each line.
It is easiest to explain this with an image. Figure 15 is a photograph of some graph paper on which I wrote 36 coordinate numbers on the intersections of the lines to represent the surface of a single square tile.
Vertices in p5.js
Just like the dot-to-dot puzzle, you will define your shape using numbers – in this case, the numbers at each of the intersections that you have labelled on your graph paper. The formal term for one of the dots in a shape is a vertex – the plural is vertices.
The more vertices you have, the more complex the shapes you can create; they are much more versatile than the circles and squares you have used so far.
You will tell the p5.js program that you want to make a shape by giving the command beginShape() and then give the series of vertex points that need to be joined. The command to finish making the shape is endShape(CLOSE). You can use as many vertices as you want to make your shape.
Note, each vertex point has an x- and a y-coordinate. In this exercise, these two coordinates are always the same.
beginShape();
vertex(x-coordinate, y-coordinate); //one vertex point
vertex(x-coordinate, y-coordinate); //another vertex point
vertex(x-coordinate, y-coordinate); //another vertex point
endShape(CLOSE);
To draw a triangle you need three vertices, while a square has four vertices and a pentagon five. When using vertices, your shapes don’t have to be ordinary geometric shapes; you can create more complex and funky designs.
(p5.js reference: vertex [Tip: hold Ctrl and click a link to open it in a new tab. (Hide tip)] )
Creating a tile design
To create a tile design, start with the graph paper and connect some of the numbered intersections. You don’t have to start in the corner with dot 1.
For Figure 16, I drew a tilted square with smoothed off corners on the graph paper. I used some yellow stickers to highlight the eight vertex coordinates that I need to write down to transcribe this shape into p5.js.
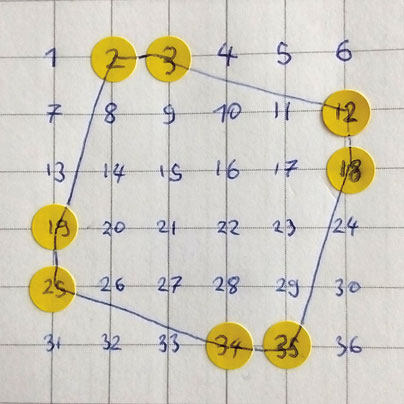
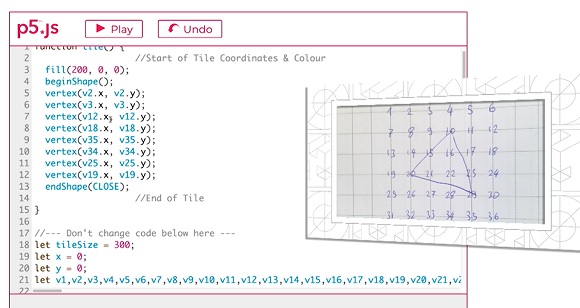
In Figure 16, I drew a shape that connects the dots 2, 3, 12, 18, 35, 34, 25, and 19. To make this shape appear in p5.js, you have to use these coordinate numbers as vertex coordinates. I started in the top left-hand corner, going clockwise, but it doesn’t matter where you start, as long as you go through all the coordinates in a continuous sequence. This is the code for recreating the shape in p5.js:
fill(200, 0, 0); //This is the fill colour - a red
beginShape(); //This starts drawing the shape
vertex(v2.x, v2.y); //The first dot with x and y-coordinates
vertex(v3.x, v3.y);
vertex(v12.x, v12.y);
vertex(v18.x, v18.y);
vertex(v35.x, v35.y);
vertex(v34.x, v34.y);
vertex(v25.x, v25.y);
vertex(v19.x, v19.y); //The final dot in the shape
endShape(CLOSE); //This finishes drawing the shape
Each line of the vertex code represents a single coordinate point that is connected together to form the shape. You can add as many vertex points as you like by inserting new lines of code. You don’t have to return to your starting point because the shape will automatically be closed by the command endShape(Close).
The code uses variables starting with the letter v, followed by the number of the dot coordinate. So, dot 12 from the graph paper becomes v12 in the program. Each vertex needs both an x- and a y-coordinate. For this program, the numbers for the x- and y-coordinates are the same. The vertex for dot 12 would be written as vertex(v12.x, v12.y); The command ‘vertex’ tells the program you are giving information about a specific point and the information in brackets gives the detailed information. Note the full stops, commas, and the semicolon after the bracket:
vertex(v12.x, v12.y);
Look at Program 6 Dot-to-dot tile maker, below. There is a single function called tile() that starts in line 1 that you need to make changes to. The fill() command in line 3 controls the colour of the shape. The shape itself starts in line 4 with beginShape() and ends with endShape(Close) in line 13. In between are the vertex points. This is where you will substitute your own coordinates to create your own tile decorations.
There is a comment in line 17:
//--- Don’t change code below here ---
The code below this point makes the coordinate system easier to work with, but you don’t have to understand how this code works or make any changes here.
In the next activity, you can use Program 6 to create your own tile design.
Activity 5 Create your tile design
Create your own tile design on graph paper and then transcribe it into code.
Write the numbers 1 to 36 on the intersections of a 5 × 5 grid on some graph paper.
Connect some of the intersections to create a shape for your tile design.
Transcribe these dot coordinates from the graph paper into Program 6 Dot-to-dot tile maker. Click on Play to rerun the program.
Choose the colour of your tile using the fill() command. You might find it useful to use the RGB colour selector which you used in Principle 4: Colour.
If the visual output is not what you expect, check that you are inserting both the x- and y-coordinates for each vertex, for example vertex(v12.x, v12.y). Reread the text above about vertices.
If the program doesn’t run, make sure that you haven’t written your coordinates in the wrong place. Look for the comments to help guide you to the place to change the code.