

5 Why not design for the ‘average’ user
This section explains why it can be misleading to design for an average user; a complete user population should be considered, and often it is more relevant to design for the smallest, tallest, weakest etc. Designing to include extreme users can also benefit the great majority of users.
Even when user needs are being considered in design, it is still relatively easy for the designer to fall into the trap of designing for the average user. On the face of it, it seems a good idea to design for the average user. Obviously people do vary but there are limits to variation and surely it should be possible to design around the needs of the majority of average people?
The problem is that although it is relatively easy, for example, to measure body dimensions of a large group of people and determine what the average values are, it is quite difficult to find individuals who are average in more than just a few of these.
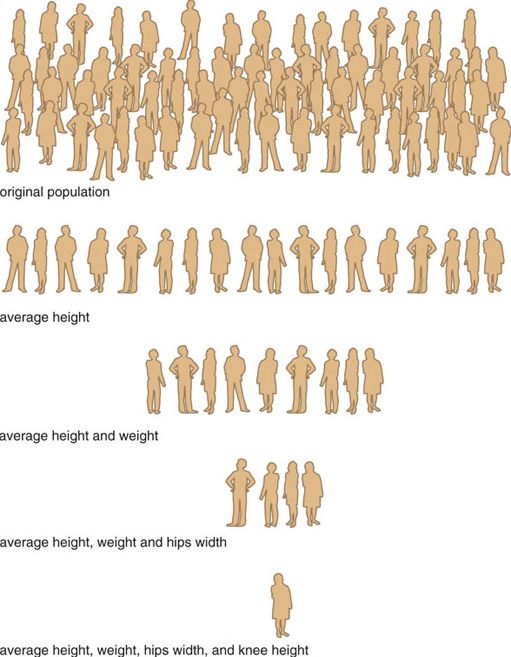
An experiment conducted in the United States of America illustrates this point (Bailey, 1982). The averages of a large number of physical body dimensions such as standing height, arm length or chest circumference are already well known for US adult men. For this study, 4063 males were selected at random and measured to see how well they conformed to the known averages for their population. The first measurement was of standing height and out of the original sample of 4063, only 1055 or 25.9 per cent were found to be close to the average. The rest of the sample were allowed to go home and the experiment continued with only those who were of average height. They were next measured for chest circumference and it was found that only 302 or 7.4 per cent of this group were of both average height and chest measurement. All those not average in both respects were sent home and the experiment continued in this way, working through ten simple dimensions in all.
By the time the experimenters got to the tenth set of measurements only 2 subjects were left in the sample and after the tenth measurement even they were eliminated. They had run out of people to measure. No-one from the original sample of 4063 subjects was average in all 10 of the dimensions measured. The explanation is of course that every human being is unique, bodily dimensions vary quite widely both in terms of absolute size and in proportion to each other. In other words, the average person is rather unique.
Nevertheless it is possible to define populations that have characteristics that are similar to or different from other populations. Generally speaking adults are taller than children, so age is one criterion we can use to define different user groups. Another is sex: men tend to be taller than women, although some women are of course taller than some men.
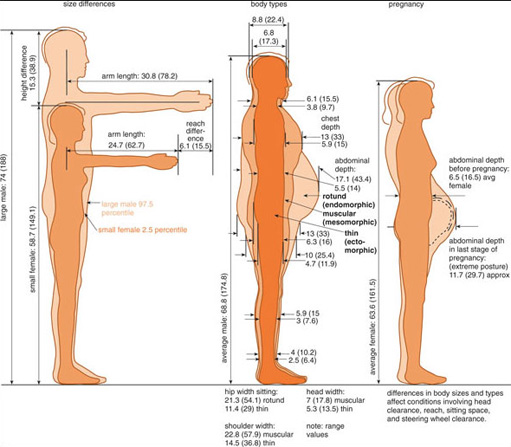
Physical condition is another way of looking at systematic variation between different populations. Pregnancy and obesity are conditions that have obvious implications for size and shape. Disabilities that limit movement or that affect physical size and shape may be another way of defining user populations usefully. Factors such as age, size, occupation, leisure interests and personal values may all be relevant characteristics in defining the user population. So when we talk about the typical user we need to make sure that we actually have a truly representative range of typical users in mind.
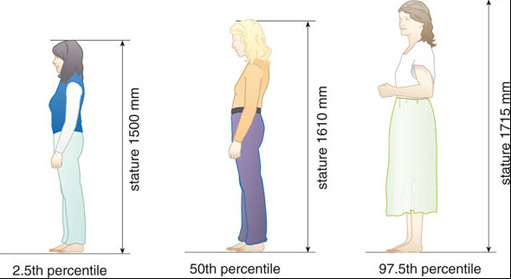
One common way of defining the range of a user population is the so-called method of extremes. Using this method, sample users are selected to represent the extremes of the user population plus one or two intermediate values. In a study to establish recommended kitchen work surface heights, three groups of sample female users were selected for the experiments (as seen in the animation above).
The shortest is around the 2.5th percentile of the stature range, that is, 1500 mm ± 25 mm.
The mean is around the 50th percentile of the stature range, that is, 1625 mm ± 25 mm.
The tallest is around the 97.5th percentile of the stature range, that is, 1740 mm ± 25 mm.
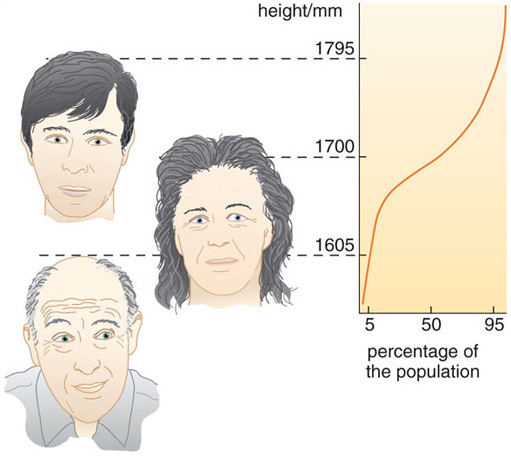
The idea of a percentile is quite straightforward. It is that proportion of the population under consideration with a dimension at or less than a given value. So, for example, if the 95th percentile for the standing height of a population is 1795 mm, then 95 per cent of that population are 1795 mm or shorter.
This is shown graphically in Figure 7. The horizontal axis shows what percentage of the total population reach a particular height and the vertical axis represents a range of different standing heights. From this figure you can see that 95 per cent of this particular population are 1795 mm or less tall, whereas only 5 per cent are 1605 mm or less, and 50 per cent are 1700 mm or less. Therefore, someone with a standing height of 1605 mm is at the 5th percentile, someone 1700 mm tall is on the 50th percentile and someone 1795 mm tall is at the 95th percentile of this population.
Test your understanding
Why should designers not design for the average user?
Answer
My response
Through focusing on the average user, the producers and designers of products may be overlooking the needs of large sections of the population. Design needs to take into consideration the variations due to size, age and disability, and other factors such as circumstances of use and strength.