Learning Outcome 2: Access and Collate Data
Information Sheet 1.2-1:
Structuring Data for Analysis
The National Competency Assessment process generates valuable data points that must be systematically accessed, compiled, and organized to transform individual candidate results into meaningful information. This process of Accessing and Collating Data is the critical bridge between conducting assessments and generating useful reports, statistics, and certifications. Proper collation ensures data integrity, enables trend analysis, and supports evidence-based decision-making for Assessment Centers and TESDA as a whole.
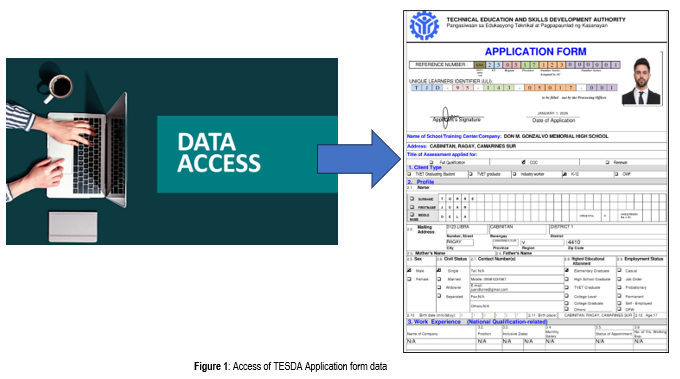
Accessing data refers to the systematic retrieval of information from the various assessment forms and records after the assessment has been completed.
Collating is the process of organizing raw data into a structured format. This makes it easier to analyze, process, and eventually, encode.
Using Electronic Tools: The most common tools for collating data are:
- Spreadsheets (e.g., Google Sheets, MS Excel): Ideal for organizing data into rows and columns. You can sort, filter, and perform calculations.
- Word Processors (e.g., Google Docs, MS Word): Useful for collating textual data or creating structured reports.
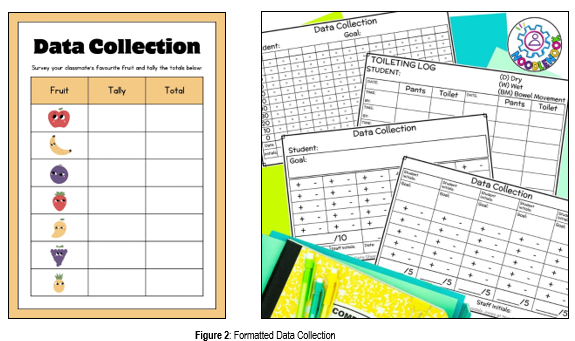
Formatting Data Collection Sheets: A well-formatted collection sheet is your best friend. It should be designed to match the flow of the raw data, making it easier and faster to enter. For example, the columns in your spreadsheet should be in the same order as the fields on the paper form you are transcribing.
The 5S Practice: 5S is a widely adopted industry practice for maintaining an orderly and efficient work environment. For data encoders, this applies to your digital workspace:
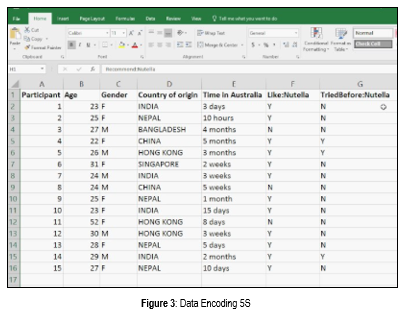
- Sort: Remove unnecessary files from your working folder.
- Set in Order: Create a logical folder structure and use a consistent file naming convention (e.g., ProjectName_DataSource_Date.xlsx).
- Shine: Keep your desktop clean and organized.
- Standardize: Make this organization method a habit.
- Sustain: Regularly maintain your organized system.
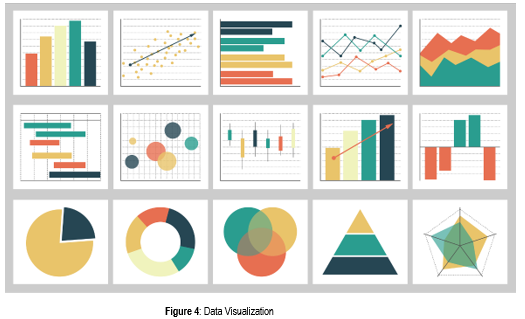
Data Visualization: This is the practice of transforming data into visual formats, such as charts and graphs. While not part of collation, understanding this concept helps you appreciate why structured data is so important.