9.7 Control-model diagrams
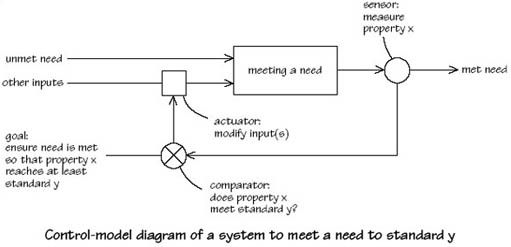
Perhaps, like me, you are beginning to form the view there were some ambiguities about purpose in the case-study situation. Control models are a useful way of investigating purpose and the means in place to achieve it. They address issues like ‘What is X trying to achieve?’ ‘How are they trying to do it?’ and ‘How will they know when they've done it?’ Control-model diagrams provide a structure for exploring these questions. The drawing of the model allows you to decide whether the elements are in place to support the achievement of the purpose – and whether they are the right elements.
To get started on this, you could use one of the purposes you identified earlier. And, by expressing it in terms of a simple transformation, work through the formal elements of the diagram seeing if the elements were there and linked together in appropriate ways. Using the control-model form as a diagnostic tool, as you are here, often means you don't get a diagram that conforms to the rules. This is precisely the point. If the diagram doesn't work, it is because the system is not connected together in a way that would allow it to work, or because some of the elements are mismatched or missing.
The output from your diagnosis can then take the form of a precise description of the reasons for its failure to effect the transformation, or achieve the purpose it was meant to achieve. It can also suggest means of improving the performance of the system in achieving its purpose: by adding missing components; by connecting components of the system together in other ways; by changing components so that they better match the intention; or by, for example, using alternative measures of performance.
Spend about 20 minutes on the next activity.
Activity 27
Draw a control-model diagram to diagnose a system you have found within the case study that does not seem to be achieving its purpose adequately.
First, identify a system in the case study that you believe is not working as well as it should.
Think of the system as a transformation process in which an input or inputs are converted into an output or outputs. Draw this as a transformation diagram such as I have drawn in Figure 17. You will, of course, have different labels to my general ones.

Next, identify a purpose for this system. The idea is, if the transformation process is working properly, this purpose will be met. Express this purpose in the title of your diagram.
Now express the purpose as a goal.
Next, ask yourself how you will know if the transformation process is working properly. Then consider what property or quality in the output you would have to measure to find out if the transformation process is working properly.
Now return to your idea of the goal: can it too be expressed in terms of the same property or quality?
You may have to iterate between your ideas of goal and what you will measure.
When you are satisfied with your goal and measurement, represent them by converting your transformation diagram into a control-model diagram.. Label the actuator, sensor, goal, and comparator appropriately. I have shown a general form in Figure 18.

Compare your diagrammatic representation with the system you identified within the case study. Can you now see why the system in the case study does not work as well as it should? You have drawn an idealised system; the ‘real-world’ system may not be working because some important control element is missing.
Use you diagram to specify possible changes that might improve the system's capacity to achieve its intended purpose.
