

9 Repeated measures t-tests
In this activity, you will learn how to carry out a repeated measures t-test in Jamovi. Unlike the independent samples t-test, which compares scores for two separate groups of participants, a repeated measures t-test is used when the same participants provide data in both experimental conditions.
Activity 8: Repeated measures t-tests
The video uses a fictional research example inspired by studies examining the so-called ‘Hungry Judges’ effect – the idea that hunger may influence decision-making. In this example, participants rate the severity of fictional crimes before and after a lunch break, allowing researchers to investigate whether sentencing decisions differ depending on hunger levels.
As you work through the activity, you will learn how to:
- recognise when a repeated measures design is being used
- understand how repeated measures datasets are organised in Jamovi
- run a paired samples t-test in Jamovi
- interpret descriptive and inferential statistics from the output
- report and interpret repeated measures t-test findings appropriately.
The video explains how repeated measures data differs from independent groups data, demonstrates how to select paired variables for analysis, and guides you through interpreting the resulting output, including the means, standard deviations, t-values, degrees of freedom, and significance values produced by Jamovi.
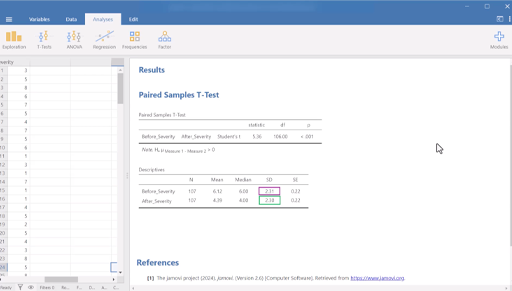
Transcript: Video 7: Repeated measures t-test
File: Repeated measures t-test [Tip: hold Ctrl and click a link to open it in a new tab. (Hide tip)]
Now you have seen how to carry out a repeated measures t-test in Jamovi, you can practise these skills yourself using the example dataset provided alongside this activity. Try reproducing the same analysis and explore how the output changes when different options are selected.
You can download a PDF version of this tutorial, and the dataset used in it below:
File: Repeated measures t-test tutorial
File: Paired t-test dataset