

6 Correlation
In previous activities, you learned how to enter data into Jamovi and produce descriptive statistics to help summarise and explore a dataset. In this activity, you will move on to one of the most commonly used inferential statistical techniques in the social sciences: correlation.
In research, inferential statistical tests are often used to test hypotheses. A hypothesis is a prediction about what researchers expect to find in their data based on theory, previous evidence, or observation. For example, a researcher may predict that higher stress levels will be associated with poorer sleep quality; that increased age may be related to poorer memory; or that increased exercise will be linked to higher wellbeing.
Correlation analyses are used when researchers want to investigate whether two variables are related to one another. They examine whether changes in one variable are associated with changes in another. Relationships may be positive (both variables increase together) or negative (as one variable increases, the other decreases).
Activity 5: Correlation
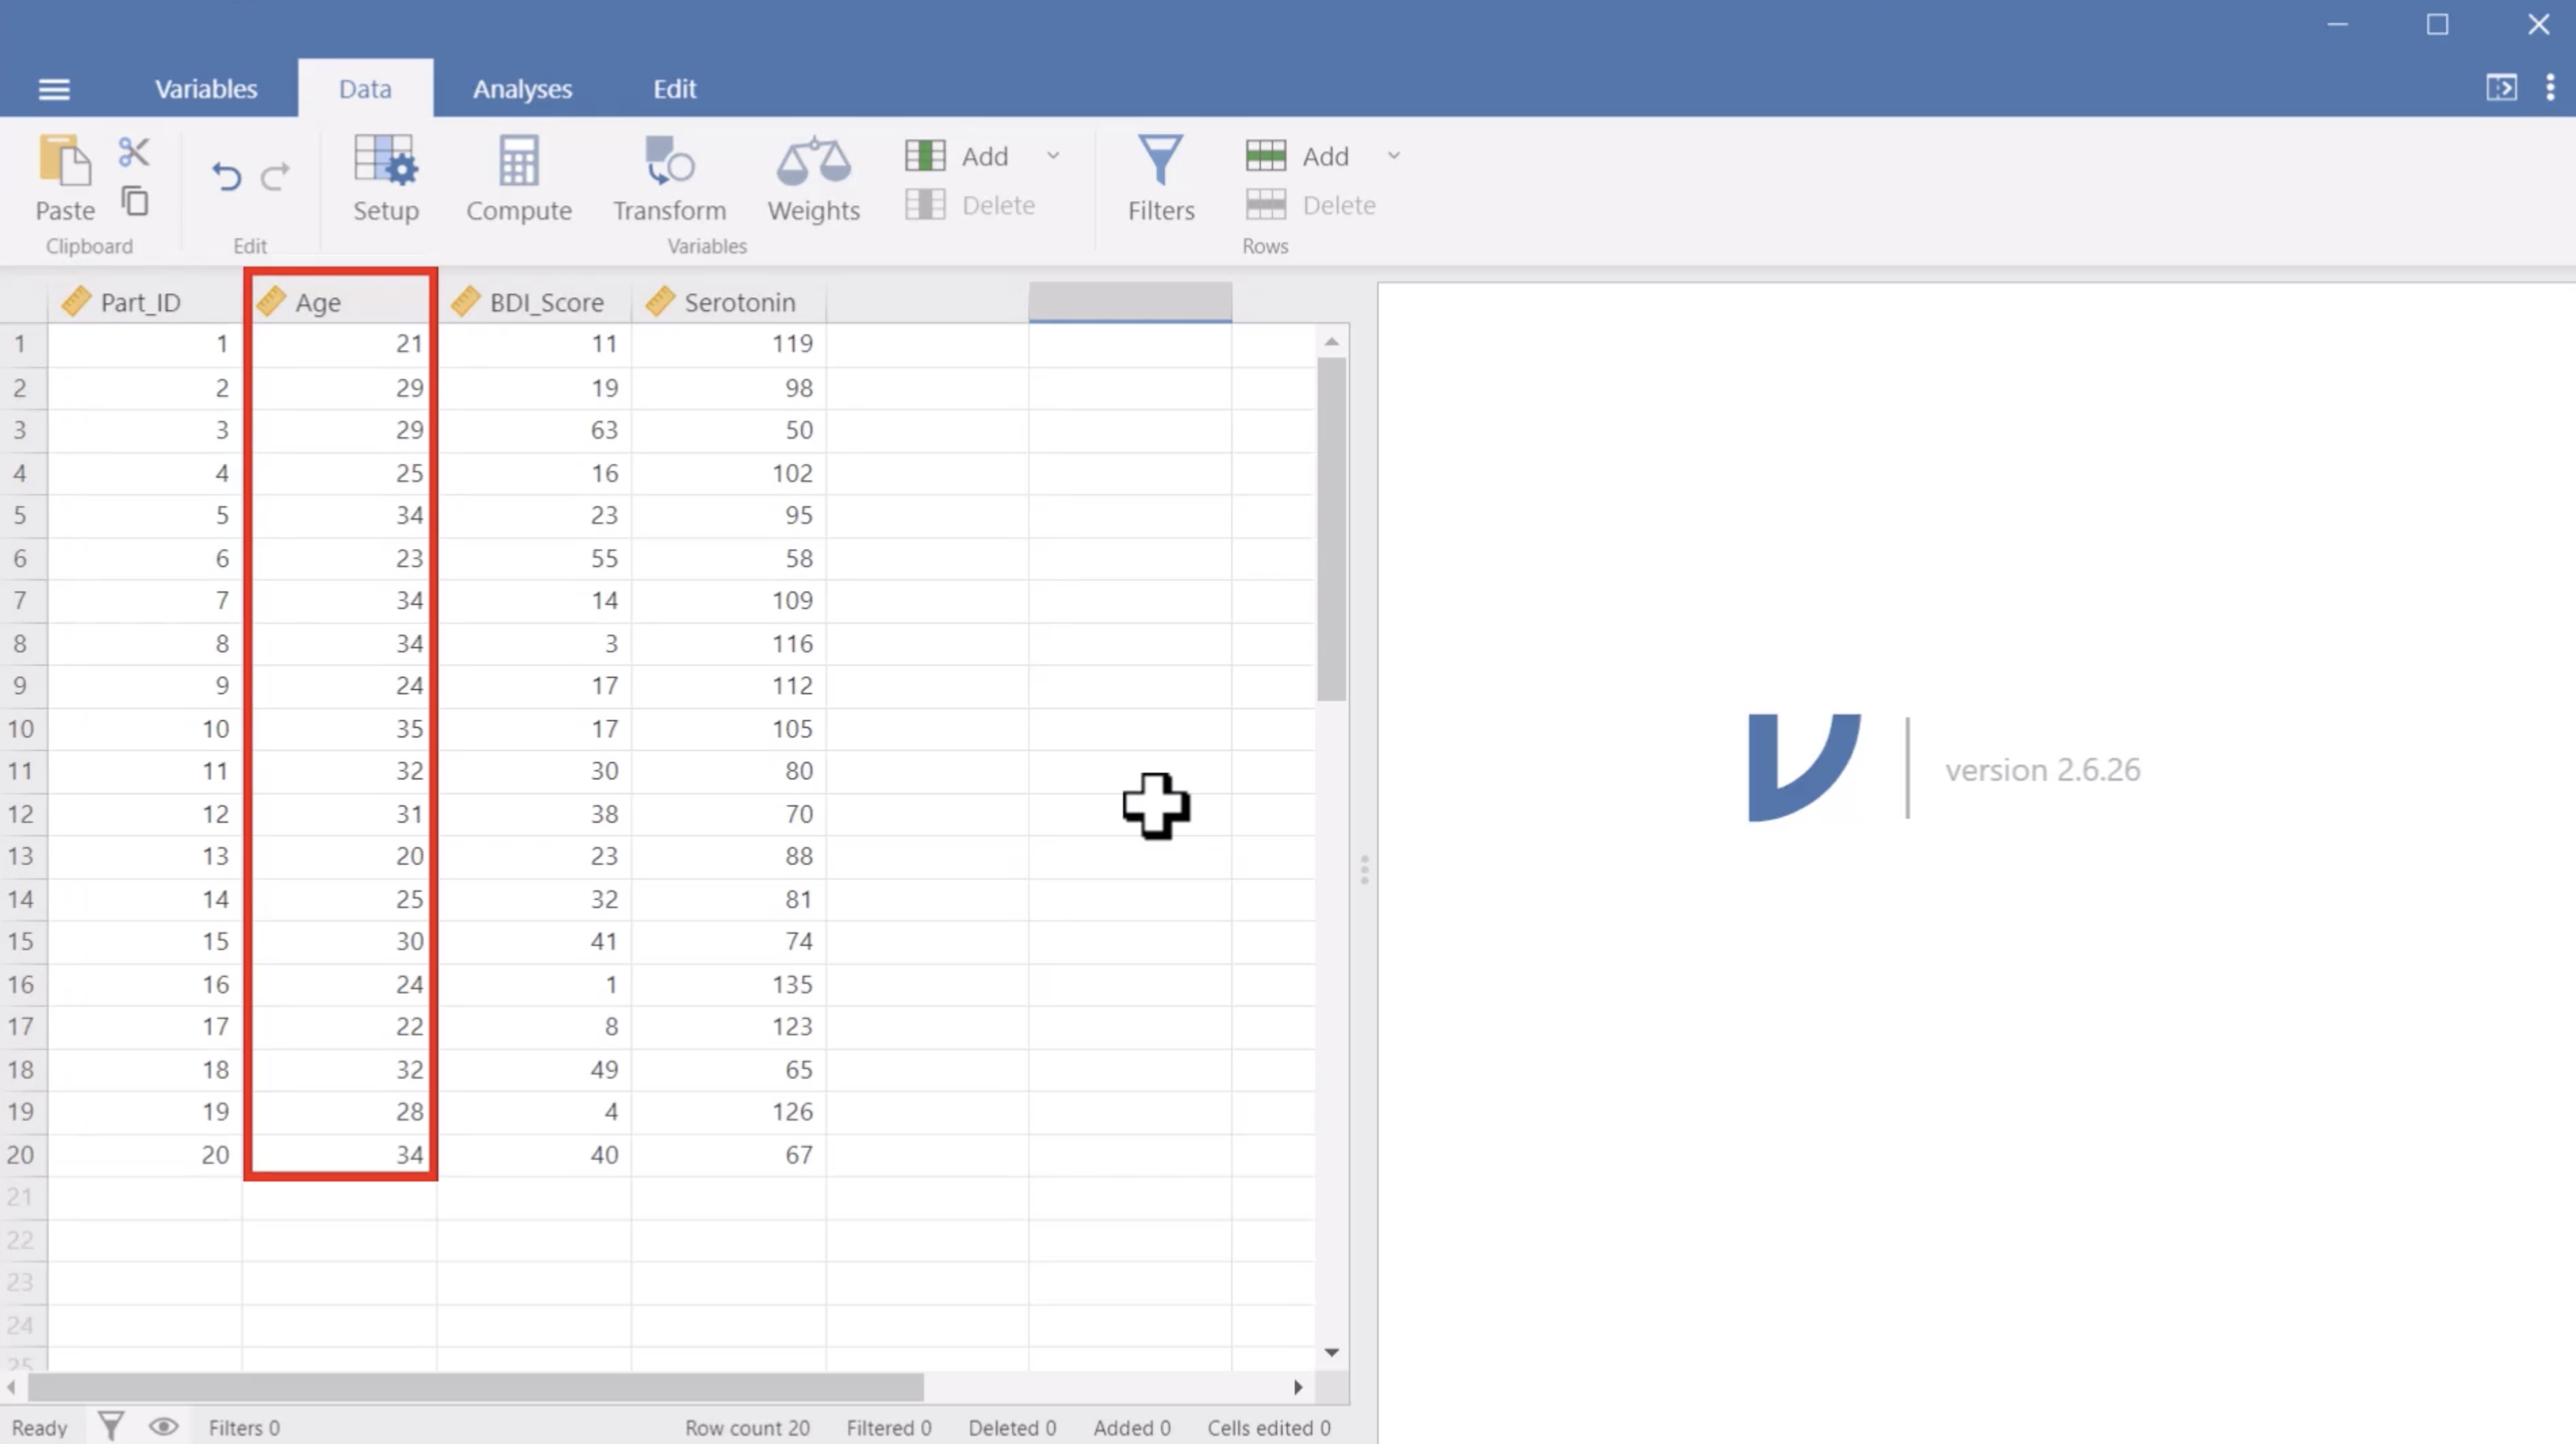
The video uses a fictional research example investigating the relationship between mood and serotonin levels. In the example, participants complete a standardised questionnaire measuring depression, while serotonin levels are assessed using blood samples. The aim is to investigate whether lower serotonin levels are associated with higher levels of depressed mood. Specifically, the hypothesis predicts that ‘there is a negative correlation between serotonin and depression score’.
As you work through the activity, you will learn how to:
- run a correlation analysis in Jamovi
- select variables for analysis
- interpret the direction and strength of a correlation
- understand statistical significance within the correlation output
- report and interpret correlation results appropriately.
The video will guide you through the process of carrying out a Pearson correlation using the Correlation Matrix option in Jamovi, as well as explaining how to interpret the output produced by the software.
Transcript: Video 4: Correlation
File: Correlation [Tip: hold Ctrl and click a link to open it in a new tab. (Hide tip)]
Now you have seen how to carry out a correlation analysis in Jamovi, you can practise these skills yourself using the example dataset activity which you can download below and open using the File menu in Jamovi. Try reproducing the same analysis and explore what happens when you include additional variables in the correlation matrix. You can download a PDF version of this tutorial, and the dataset used in it below:
File: Correlation tutorial
File: Correlation dataset
Practising these techniques yourself will help you become more confident both in using Jamovi and in understanding how correlations can be used to investigate relationships between variables in research.