

2.1 The carbon footprint of UK individuals and households
The average (mean) carbon footprint of an individual living in the UK can be calculated by dividing total UK annual CO2 equivalent emissions by the number of people in the country. Using the official government information in Figure 4, this produces a mean footprint of 16.4 tonnes CO2 equivalent per person per year in 2013.
This provides a realistic mean footprint of a UK inhabitant on a consumption basis because it includes CO2 and other GHG emissions, and takes the data on emissions embedded in imports into account. Before 2013, embedded emissions were under-counted, but with improved data on international trade, global deforestation, etc., more reliable information is available. The estimated mean UK carbon footprint (updated to 2016) is 14.6 tonnes CO2e per person, per year – this is the figure used in the carbon calculator that you’ll be using later.
Several studies have attempted to provide a more detailed breakdown of this carbon footprint than given in Section 1 (e.g. Druckman and Jackson, 2010). Unfortunately, as they produce different results depending on the data sources, the methods used and how the breakdown is categorised, when writing this course a decision had to be made as to what to present from a number of studies and reports.
One useful study, which was drawn upon to develop the carbon calculator, breaks down an individual’s mean CO2 equivalent emissions into a few high-level categories (Table 1).
| Sector | GHG emissions per person per year (tonnes CO2e) | Percentage |
|---|---|---|
| Domestic energy and housing | 3.98 | 26.2 |
| Transport | 3.78 | 24.9 |
| Food | 2.07 | 13.6 |
| Consumables (i.e. goods) | 1.83 | 12.1 |
| Private services (e.g. banking) | 1.68 | 11.1 |
| Public services | 1.78 | 11.7 |
| Total emissions (incl. other) | 15.18 | 100.0 |
More detailed footprint breakdowns for the whole of the UK are difficult to find. But there are detailed studies at local authority level, such as a study of the carbon footprint of Greater Manchester residents (Figure 5).
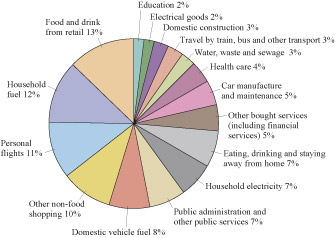
The annual carbon footprint of Greater Manchester residents is estimated at 41.2 million tonnes CO2e. This makes a Manchester resident’s mean footprint 15.7 tonnes. Just over a quarter (27%) of the Manchester footprint is for personal transport (car fuel, flights, public transport and the carbon embedded in cars themselves). Fuel use in homes adds a further 19%. This means that household energy and transport make up almost half (46%) of the total carbon footprint. The rest of the footprint is a mixture of embedded carbon in food and other goods, a wide range of services (from hotel accommodation to financial services) and public services such as education, healthcare, defence and government. This is similar to the breakdown in Table 1 where domestic construction (housing) is combined with household energy use.