2.3.2 Total carbon footprints
The picture of carbon footprints changes again when you consider total CO2 emissions for different countries rather than emissions per person. Table 4 shows that by 2011 China had become by far the greatest total emitter of CO2, followed by the USA and India. In terms of consumption-based emissions too, the three greatest CO2 emitters were China, the USA and India (CCC, 2013).
| Country | Total CO2 (2011), million tonnes per year (rounded) | Total CO2 (2015 est.), million tonnes per year (rounded) |
| China | 9020 | 9680 |
| United States | 5306 | 5561 |
| India | 2074 | 2597 |
| Russian Federation | 1808 | 1595 |
| Japan | 1188 | 1232 |
| Germany | 730 | 789 |
| Saudi Arabia | 520 | 602 |
| South Africa | 477 | 476 |
| United Kingdom | 448 | 428 |
| Brazil | 439 | 507 |
| Australia | 369 | 382 |
| France | 339 | 331 |
| Turkey | 321 | 573 |
| Thailand | 303 | 337 |
| Egypt | 221 | 237 |
| Pakistan | 164 | 168 |
| Nigeria | 88.0 | 93.6 |
| Romania | 84.8 | 72.6 |
| Israel | 69.5 | 67.2 |
| Sweden | 52.1 | 44.3 |
| Ireland | 36.1 | 35.9 |
| Uganda | 3.8 | 4.3 |
| World average (mean) | 150.8 | (World total 36 292) |
(CDIAC, 2015; Global Carbon Atlas, 2016)
Footnotes
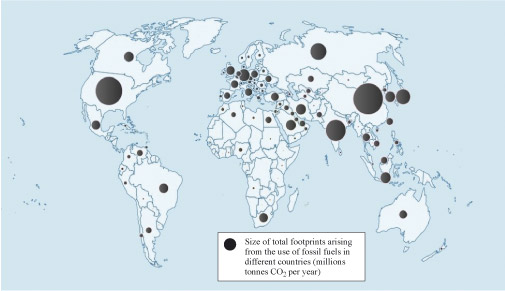
Note: the CO2 emissions shown in Tables 2 and 4 are based on from burning fossil fuels, cement manufacture and gas flaring.Figure 10 shows more of the same information updated using estimations to 2015, when China, USA and India emitted half of the world’s CO2.