

2.2.4 Relative frequency distribution tables
Relative frequency distribution is another type of frequency distribution. This type of distribution tells you the proportion of each value or class interval of a variable. In other words, relative frequency distribution describes the number of times a particular value occurs in relation to the total number of values. You can use this type of frequency distribution for any type of variable when you are more interested in comparing frequencies than the actual number of observations.
For example, Team A has won 6 football games from a total of 12 football games played. The frequency of winning is 6 and the relative frequency of winning is 50% (i.e. 60/12=0.5).
You will learn how to make a relative frequency table in Excel in the following activity.
Activity 4 How to make a relative frequency table in Excel
In this activity, you will build a relative frequency table using the ungrouped frequency distribution table from Activity 2. Once you have made the relative frequency distribution table in Excel, check your answer by clicking ‘Reveal discussion’ below.
The ungrouped frequency distribution table consists of three columns. Column A is labelled ‘Generators’, Column B is labelled ‘Value’ and Column C is labelled ‘Frequency’. Add a fourth column to the table for the relative frequencies.
To calculate the relative frequencies, you need to divide each frequency by the sample size (frequency / sample size). You can calculate the sample size by taking the sum of all the frequencies in Column C, which is 24.
Comment
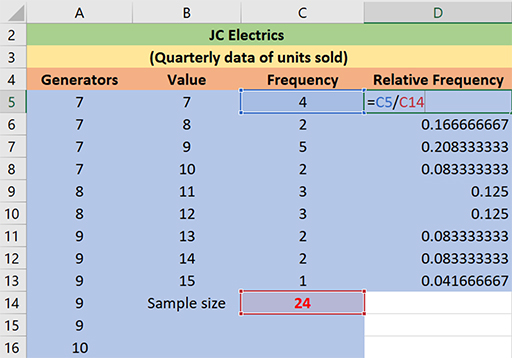
Figure 15 represents the quarterly data of number of units of generators sold. Column A (‘Generators’) contains values between 7 to 15. Column B is labelled ‘Value’. Column C is labelled ‘Frequency’.
To calculate the relative frequency in Column D, you need to divide each frequency by sample size. The sample size of 24 can be found by summing the ‘Frequency’ column.
In the next section, you will learn how to make cumulative frequency distribution tables in Excel.