1.2 Opening an Excel file
Excel stores the data in files that contain one or multiple worksheets. When you open a worksheet by double-clicking the Excel icon, it will usually display the data contained in the last active sheet. For this course, you will be using a pre-populated worksheet for JC Electrics, a company manufacturing heavy machinery, such as generators, transformers and electric motors. Download the file at the link below. You can then save it to your computer so you can return to it at different points in the course. The file will also be linked at future points in the course.
Download the file JC Electrics [Tip: hold Ctrl and click a link to open it in a new tab. (Hide tip)] .
Click on File, then Open and navigate to the folder in which you saved this file and open the file by double-clicking it.
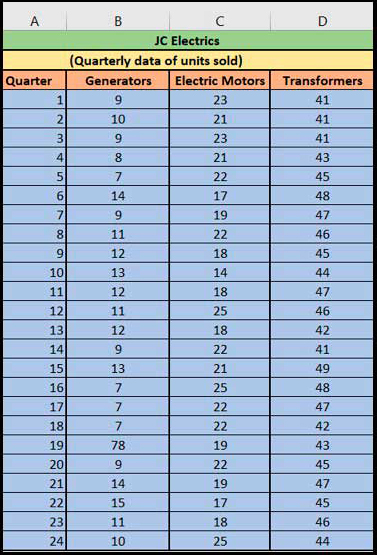
By opening the worksheet, you should see quarterly data of units sold by JC Electrics in four columns. The screenshot below shows a spreadsheet with these columns labelled as: ‘Quarter’, ‘Generators’, ‘Transformers’ and ‘Electric Motors’.