2.4 Frequency density
Frequency density is defined as the frequency per unit of the data in each class. Frequency density is calculated by dividing the frequency by the class width (the class width is the difference between the upper limit of the class interval and the lower limit of the class interval). Frequency density allows for a meaningful comparison of different classes where the class width may not be equal.
The frequency density gives the ratio of the frequency of a class to its width. Frequency density is used to plot a frequency density histogram; here, you plot frequency density instead of frequency on the y-axis. Frequency density gives you the total area of bars and tells you about the frequency in the histogram (rather than the height).
You can calculate frequency density when you have a set of grouped data that consists of unequal widths of class intervals. For example, see the following Excel worksheet in Figure 22, which shows information about the ages of a group of people playing football.
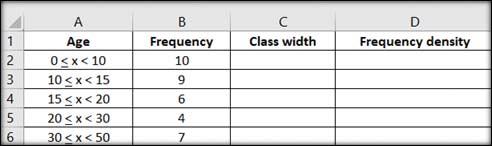
To calculate the frequency densities:
- In Column C, find the class width of the class intervals by finding the difference of upper and lower bounds/limits. (For example, , and so on.)
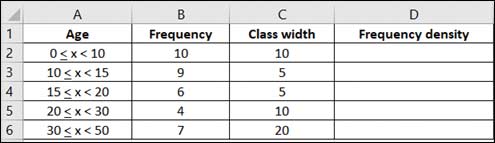
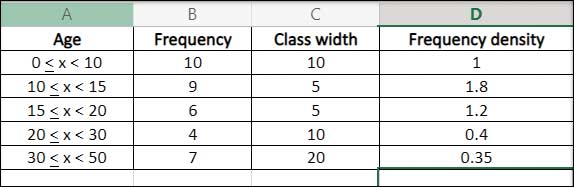
- Then, in Column D, divide the frequency of each class interval by its width.
In the activity below, you will test your knowledge of the difference between a frequency density histogram and a frequency histogram.
Activity 7 The difference between frequency histograms and frequency density histograms
Watch the video below and note down in the box the difference between frequency histograms and frequency density histograms.