

2.2.5 Cumulative frequency distribution tables
Cumulative frequency distribution is the fourth type of frequency distribution table. It is the sum of the frequencies less than or equal to each value or class interval of a variable. This type of frequency distribution can be used for ordinal or quantitative variables, especially when you want to understand how often observations fall below certain values.
For example, Company A sells 250 books in the first week, 150 books in the second week and 400 books in the third week. The cumulative number of books sold in the second week by Company A is 400 books (250 books in the first week + 150 books in the second week). The cumulative number in the third week is 800 books (250 books in the first week + 150 books in the second week + 400 books in the third week).
In the following activity, you will learn how to build a cumulative frequency distribution table in Excel.
Activity 5 How to make a cumulative frequency distribution table in Excel
In this activity, you will build a cumulative frequency distribution table using the grouped frequency distribution table in Activity 3. Once you have built the cumulative frequency distribution table, you can check your answer by clicking ‘Reveal discussion’ below.
Borrow the grouped frequency distribution table from Activity 3. This table consists of five columns. Column A is labelled Generators, Column B is labelled Class intervals, Column C is labelled Lower limit of class interval, Column D is labelled Upper limit of class interval and Column E is labelled Frequency.
Add another column, Column F, to the table for the cumulative frequency. The cumulative frequency is calculated by adding each frequency from a frequency distribution table to the sum of its predecessors. The last value will always be equal to the total for all observations, since all frequencies will already have been added to the previous total.
Comment
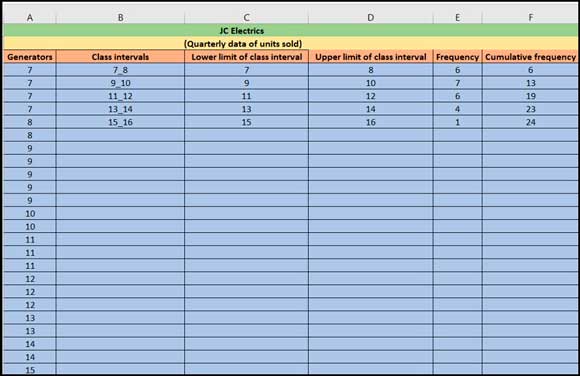
Figure 16 presents the data of the number of generators sold. Column A (‘Generators’) shows the values between 7 to 15 in ascending order. Column B shows the class intervals. Column C shows the values of the lower limit of each class intervals. Column D shows the values of upper limit of each class intervals. Column E shows the frequency.
To calculate the cumulative frequency in Column F, add each frequency to the frequencies in the previous rows. If you do it correctly, the value in the last row will be equal to the sample size.
In the next section, you will learn how to visualise these tables by drawing histograms in Excel.