2.5 Wavelength
So far we have seen that sound is a pressure wave, and that the spacing of the pressure variations is related to the period of vibration of the source.
A graphical representation of the pressure wave from a tuning fork closely approximates to a certain type of wave known as a sine wave.
If we freeze the pressure wave as a snap shot in time, the variations in pressure with distance from the tuning fork can be plotted as a sine wave. The vertical axis is pressure so the crests of the waves correspond to the high pressure regions and the troughs to the low pressure regions. The wave length of the wave is simply the distance that the wave travels through the medium in one complete wave cycle, i.e. the distance from one region of high pressure to the next or from one region of low pressure to the next.
So if we freeze the pattern of high- and low-pressure regions in the pressure wave, we have the pattern shown in Figure 6(a), for which we can draw a graph relating pressure to distance from the fork (Figure 6(b)).
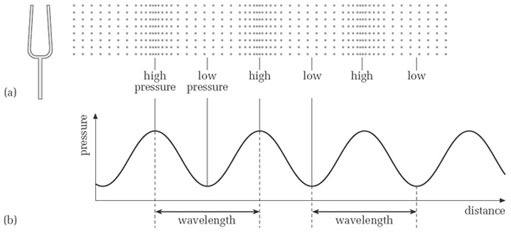
For the kind of pressure wave produced by a tuning fork, the transitions from high pressure to low pressure are not sudden. This can be seen from the graph of the pressure wave in Figure 6(b). Notice that the peaks of the graph line up with the high-pressure regions, and the troughs line up with the low-pressure regions. In between there is a smooth change of pressure.
This graph of pressure variation has a very characteristic shape, known as a sinusoidal shape. Alternatively, we can describe the graph as being a sine wave. Not many instruments produce pure sine waves, at least not when they are played in the normal way, so, as I said at the start of this unit, the use of sine waves as musical tones is limited in practice. Nevertheless, sine waves do have a characteristic sound, which it is worth becoming familiar with. The following activity gives you a chance to hear some.
Activity 8 (Listening, Exploratory)
Listen to the audio track below, which contains a variety of sine waves. How would you describe these sounds?
Click 'Play' to listen to Audio Clip
Discussion
Using the source–cause type of description, you might have described some of the sine waves as flute-like, the flute being one of the few common instruments that can produce a sine wave, or a close approximation to one.
As far as metaphorical descriptions go, sine waves are often described as ‘neutral’, ‘pure’ or ‘colourless’. You may disagree – particularly if you are a flute player.
A full discussion of sine waves and their properties would entail quite a lot of mathematics, which is beyond the scope of this unit. However, you may be interested to know that the oscillations of many smoothly vibrating systems, when plotted as a graph, have the characteristic sine-wave shape. Other examples would include the oscillations of a mass on a spring and the swinging of a pendulum, provided the oscillations are relatively small in each case.
Notice that in the pressure wave in Figure 6, the distance between any two adjacent regions of high pressure (or low pressure) is the same. This distance is called the wavelength of the sound, and is usually represented by the Greek letter lambda, λ. In fact, the distance between any two corresponding points of consecutive cycles is the wavelength. For instance, in Figure 7, points A and B are one wavelength apart, as are C and D.
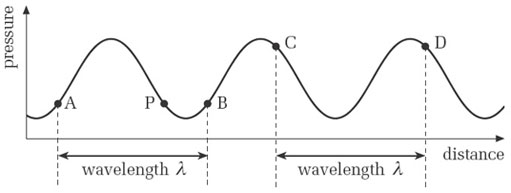
However, although point P in Figure 7 is at the same pressure as A and B, this pressure was generated at a different part of the cycle from that which generated A and B. So the distance from A to P is not a wavelength, nor is that from P to B.
All sine waves that we would describe from their sound as continuous and unchanging (like those in Activity 8) have an unchanging wavelength. The wavelengths of audible sine waves typically range from a few centimetres to several metres.
Although I have defined wavelength in terms of pressure variations produced by a tuning fork, which have a characteristic sine-wave shape, the same definition applies to non-sinusoidal periodic waves, which are the sorts of wave more frequently encountered in music.
Activity 9 (Self-Assessment)
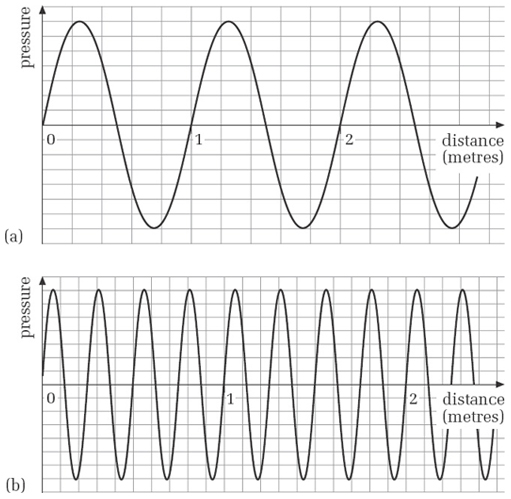
Figure 8 gives two sinusoidal graphs of pressure variations. What are the wavelengths of these pressure waves?
Answer
Each cycle of the pressure wave occupies 1 metre, so this is the wavelength.
We cannot directly read a single wavelength here, but four cycles occupy 1 metre, so the wavelength is 0.25 metre.
Note that in the time it takes a pressure wave to travel a distance equal to one wavelength, the source performs one complete cycle of oscillation. To see why this is so, consider Figure 9(a). The fork is at a particular part of its cycle, and the point X on the pressure wave is adjacent to the fork.
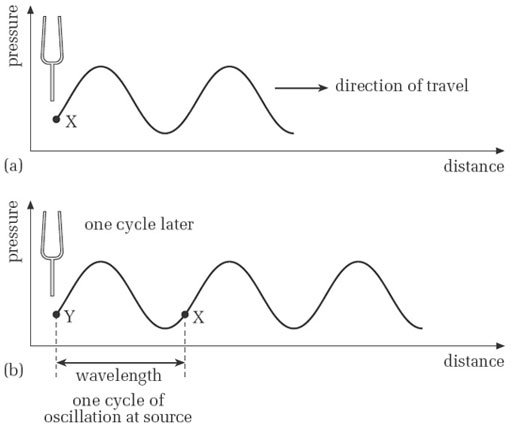
Figure 9(b) shows the situation one cycle later. The prongs of the fork are back at the same part of the cycle as in (a), and the pressure at point Y is at exactly the same part of the cycle of pressure variation as X was. In the meantime, X has travelled away from the fork a distance equal to one wavelength. Thus, in the time it has taken for the source to go through one cycle of oscillation, the wave has travelled a distance equal to one wavelength away from the fork. This is an important point, which I shall return to when we come to look at the speed of sound.
Activity 10 (Self-Assessment)
A particular tuning fork generates pressure waves with a wavelength of 1.5 metres. In the time it takes the tuning fork to perform 200 cycles of vibration, how far does the pressure wave travel?
Answer
It travels 300 metres. To see why, recall that in the time it takes for one cycle of the fork the wave travels one wavelength, which is 1.5 metres. So in the time required for 200 cycles the wave travels 200 times as far, which is 200 × 1.5 metres = 300 metres.
