
1.3 Making sense of the sequences
In the previous section you learned that millions of DNA fragments can be sequenced. But how do scientists make sense of all this information?
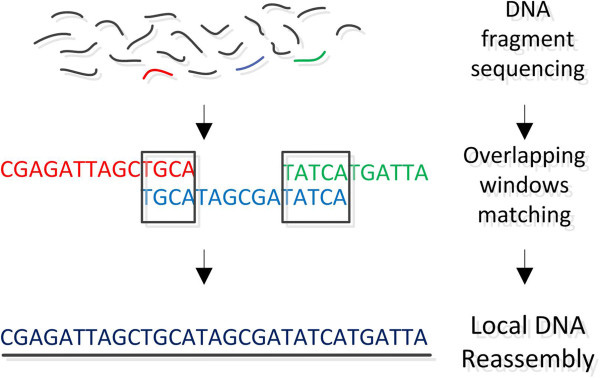
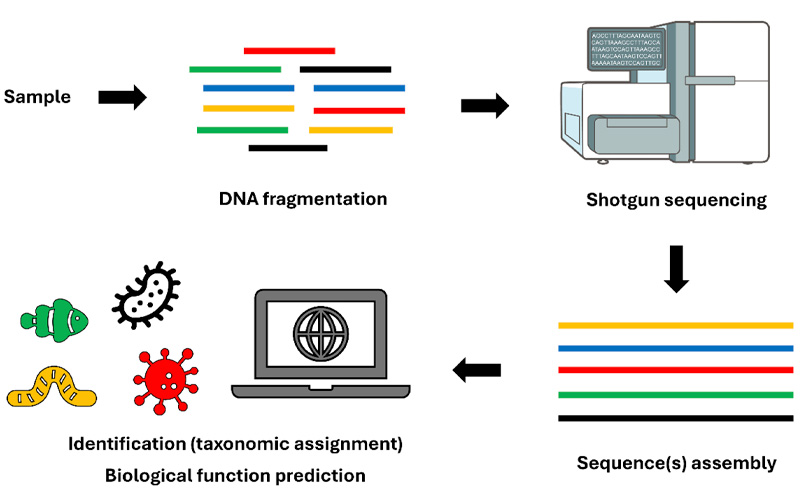
What comes next is a bit like assembling a puzzle. Powerful computer programs compare the DNA fragments and look for regions with a matching sequence of letters: When two sequences have the same letters at their ends, the program assumes they come from the same original piece of DNA and joins them together. By repeating this process many times, these fragments are combined into longer (assembled) sequences.
The computers compare the assembled sequences to known genes in a database that contains known DNA sequences from many different organisms, and identify the organism(s) they come from (taxonomic assignment). The biological function of a gene can also be predicted. For example, scientists can predict which energy source a group of microorganism uses by looking at which type of metabolic genes are found in the sample.
Sometimes, not all sequences in a sample can be identified, meaning that they don’t have a matching sequence in the databases. The more scientists sequence genomes and organisms from the environment, the bigger the databases become and so the capacity to identify and study genes with metagenomics expands.
You can imagine that metagenomic studies generate a lot of data, making their storage and sharing very important. Data are often stored in online repositories such as the NCBI Sequence Read Archive (SRA).
You will now try to make sense of some metagenomic data in a short activity.
Activity 1
In this activity, you will look at the results of a metagenomics study where total DNA was extracted from water samples from two different ponds (A and B) and then sequenced with the shotgun approach. The goal was to determine which of the two ponds had the highest number of different species in it (e.g. which pond was more biodiverse). The table below shows the DNA sequences found in the two ponds (represented as strings of A, T, G, C), but they have not been identified yet. On the right, you can see a list of reference DNA sequences of organisms expected to be found in the ponds.
Question 1
Match the DNA sequences in Pond A and B with the reference sequences on the right (coloured box) and fill the identification column with the name of the organism corresponding to the sequence
| Pond A | Identification in A | Pond B | Identification in B | HighlightedReference sequence | HighlightedOrganism |
|---|---|---|---|---|---|
| GCGCGC | TATCCC | HighlightedAATTTA | HighlightedWater flea | ||
| GCGCGC | TATATA | HighlightedGCGCGC | HighlightedMosquito | ||
| GGGCCC | AATTTA | HighlightedGGGCCC | HighlightedBacterium | ||
| GCGCGC | GGGCCC | HighlightedTATATA | HighlightedFish species A | ||
| GCGCGC | CATACA | HighlightedTATCCC | HighlightedFish species B | ||
| CATACA | AATTTA | HighlightedCATACA | HighlightedWater hyacinth | ||
| GCGCGC | AATTTA | HighlightedATAGGG | HighlightedFrog | ||
| CATACA | ATAGGG | ||||
| GGGCCC | CGGGGG | ||||
| GCGCGC | CCCCCC |
Answer
| Pond A | Identification in A | Pond B | Identification in B | HighlightedReference sequence | HighlightedOrganism |
|---|---|---|---|---|---|
| GCGCGC | Mosquito | TATCCC | Fish species B | HighlightedAATTTA | HighlightedWater flea |
| GCGCGC | Mosquito | TATATA | Fish species A | HighlightedGCGCGC | HighlightedMosquito |
| GGGCCC | Bacterium | AATTTA | Water flea | HighlightedGGGCCC | HighlightedBacterium |
| GCGCGC | Mosquito | GGGCCC | Bacterium | HighlightedTATATA | HighlightedFish species A |
| GCGCGC | Mosquito | CATACA | Water hyacinth | HighlightedTATCCC | HighlightedFish species B |
| CATACA | Alga | AATTTA | Water flea | HighlightedCATACA | HighlightedWater hyacinth |
| GCGCGC | Mosquito | AATTTA | Water flea | HighlightedATAGGG | HighlightedFrog |
| CATACA | Water hyacinth | ATAGGG | Frog | ||
| GGGCCC | Bacterium | CGGGGG | Unknown | ||
| GCGCGC | Mosquito | CCCCCC | Unknown |
Question 2
Which are the most found sequences (organisms) in the two ponds? Calculate their frequency.
As an example, if in a pond C a total of 10 sequences were found and half belong to a fish, then 5/10=50% is the frequency of fish sequences in then pond.
Answer
In pond A, mosquito sequences were the most common (6/10=60%) while in pond B sequences of the water flea (3/10=30%).
Question 3
Which of the two ponds can be considered the more biodiverse, considering the DNA sequences that you could identify?
Answer
Pond B is more diverse, because sequencing data showed the presence of up to 7 different organisms. By comparison, only 3 were found in pond A.
Question 4
Were all the sequences identified? If not, why do you think this happened?
Answer
In Pond B two sequences did not match any of the reference organisms. This means that they did not have a reference similar enough in the database used for the identification. The most likely explanation is that these sequences belong to organism(s) for which we do not have a sequence yet and they may represent unknown organisms.