

3.4 Inequality between countries
Section 3.2 considered how the flow of income is distributed within the economy. From the circular flow diagram in Figure 4 you saw another dimension of income inequality: inequality between economies. This is referred to as global inequality.
Global inequality may be interpreted in different ways. One approach would be to consider the distribution of incomes across the world as if they were part of one very large income distribution including all the world’s population.
Alternatively, you can take the income earned by the population of one country and compare this to the incomes of the population in another country.
This difference in interpretation of what global inequality is can explain differing opinions on whether global inequality has been rising or falling.
Activity 8 Global inequality between individuals
Figure 13 shows the distribution of global income among all people in the world, as if they were part of one big global economy. It compares the share of global income earned by the global top 1% to the share flowing to the bottom 50% of the global population.
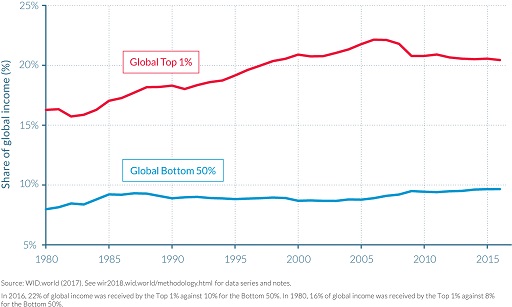
Describe how the two series shown in Figure 13 changed between 1980 and 2015.
Answer
Globally there has been an increase in the share of income going to the top 1% of the world’s population. It has risen from approximately 16% in 1980 to almost 22% in the first half of the 2000s, before falling back to close to 20% in 2015. There has been less fluctuation in the share of global income accruing to the bottom 50% of the population. Between 1980 and 2016 it was just below 10%.
What has happened to global inequality between 1985 and 2009?
Answer
Between 1985 and 2009 the gap between the shares going to the bottom 50% and the top 1% widened. While the top 1% was receiving over 20% of global income, the bottom 50% were receiving less than 9% of global income. From about 2009 onwards the share of income received by the top 1% fell and the 50% share increased, therefore suggesting a fall in global inequality.
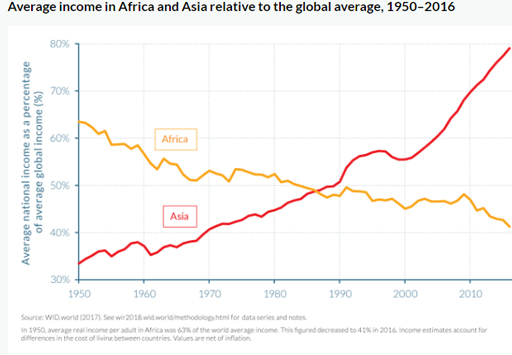
A second dimension of global inequality compares incomes earned in different countries around the world. It has been argued that the gap in incomes between rich and poor countries in the world has fallen: East Asian countries, including China, have seen a sharp growth in incomes while incomes in many developed economies have stagnated (World Inequality Review, 2018).
However there is also evidence to suggest that the gap between countries is growing. For example the share of global income going to sub-Saharan Africa and Latin America has fallen behind the world average in the same time period. As a result, in 1960 ‘people living in the world’s richest country were 33 times richer than people living in the poorest country’, rising to 134 times richer by 2000 (Hickel, 2016).
Figure 14 shows how average incomes have fallen in Latin America and Africa while those in Asia and China have steadily increased.
Activity 9 Challenges in measuring global inequality
In Activity 5 you looked at the problems with measuring incomes. What additional problems do you think would present themselves with comparing incomes in different countries?
Answer
Inevitably, international comparisons on inequality can lead to even more measurement problems than within-country comparisons. Incomes in each country will be expressed in their own currency so the figures would need to be converted to a common currency to be compared. The cost of living in countries will also vary so while residents of two countries may have similar incomes they not be able to buy the same basket of goods. The extent of the black market may vary so that the level of unrecorded economic activity and income may be significant in some countries. When looking at wider measures of equality there will be other variations across countries in the provision of social benefits and public services such as education and health.