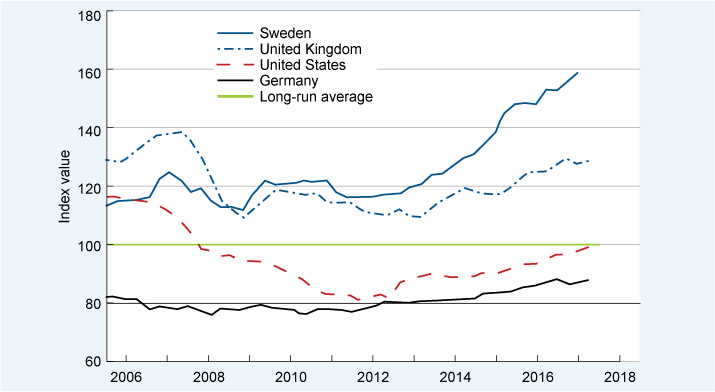
Figure 6 House price-to-income ratios relative to their long-run average for selected countries, 2006–2017. Source: authors’ chart using data from OECD (2018). Index: base value is the long-run average = 100.

Personalise your OpenLearn profile, save your favourite content and get recognition for your learning

Start this free course now. Just create an account and sign in. Enrol and complete the course for a free statement of participation or digital badge if available.