

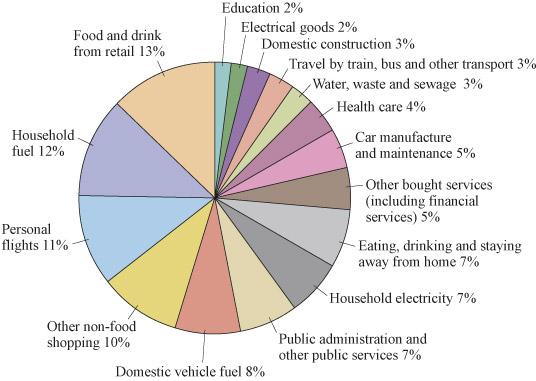
Figure 5 The carbon footprint of Greater Manchester residents, broken down by consumption category (CO2e per person per year) (Berners-Lee et al., 2011). Note: the percentages add up to over 100% due to rounding (see Study Note: Rounding numbers, decimal places and significant figures).