2.6.1 Weighing up the evidence: the full cast of suspects
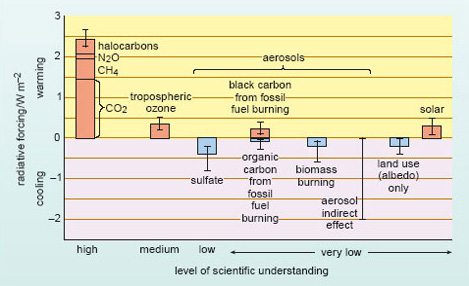
Figure 36 (again adapted from the TAR) takes your thoughts on Question 11 on a stage. It gives estimates of the cumulative effect since pre-industrial times of the various climate change agents, with the contributions expressed in terms of radiative forcing. Note that the figure also includes yet another device for communicating the IPCC's confidence in a particular finding - an indication of the 'level of scientific understanding' that accompanies each estimate. This reflects the authors' subjective judgement about the reliability of the forcing estimate, based on what is known about the factors that determine the forcing, the assumptions involved, and so on. Of the anthropogenic factors included in Figure 36, it is not surprising that there are large uncertainties, and generally very low confidence, in the estimates for various aerosols, given the difficulties touched on in Section 1.6. Clearly, this goes for the impact on surface albedo of historical changes in land use (e.g. deforestation; Question 5) as well. Only for the well-mixed greenhouse gases is confidence high.

But what about the issue we flagged up earlier (Section 1.5) - the claim by some scientists that variations in the Sun's output (and hence the solar constant), and not higher levels of greenhouse gases, have been the main driving force behind 20th century global warming? This is a complicated and controversial area, and we do not have the space to go into it in any detail. However, it's important to be aware that the estimate of solar forcing included in Figure 36 is not based on direct measurements of variations in the solar constant. Such measurements became available only with the advent of satellite-borne radiation sensors in the late 1970s. These data reveal that the solar 'constant' does, in fact, vary slightly, fluctuating up and down (by about 0.08%) on an 11-year cycle. Unfortunately, the sensors degrade over time, and it is not yet clear whether these small rapid fluctuations (which are thought to have little effect on the Earth's climate) are superimposed on an underlying trend in the average value of the solar constant (given as 1368 W m−2 in Section 1.2.1) since the measurements began.
Reconstructions of what might have been happening to the solar constant further back in time rely on various proxy indicators of changes in solar activity (such as variations in the number of sunspots), and the relationship between such proxies and possible trends in the output of energy from the Sun (the key issue) is only poorly understood. Marked differences between the available reconstructions, together with uncertainties about the satellite record, account for the very low confidence in the 'best guess' estimate of historical solar forcing in Figure 36.
SAQ 30
Given the information in Figure 36, why is it difficult to sustain an argument that the observed global warming is entirely due to solar variability?
Answer
Although solar variability appears to have made a positive contribution to climate forcing during the industrial age, the 'best guess' estimate is 0.3 W m−2 - only a small fraction of that contributed by the well-mixed greenhouse gases alone (2.4 W m−2); i.e. not counting the additional contribution from tropospheric ozone. It is inconsistent to argue that the Earth's GMST has been highly sensitive to very modest radiative forcing by the Sun, yet unaffected by substantial greenhouse forcing.
In short, the estimates in Figure 36 strongly implicate the chief 'suspect' for recent global warming - the enhanced greenhouse effect. But that does not, by itself, explain the bumpy rise in global temperature evident in Figure 24a, especially the puzzling pause in the upward trend in the middle of the 20th century (identified as a major inconsistency in Question 11). To address this issue, the starting point is a set of 'forcing histories' (i.e. reconstructions of the time-evolving change in radiative forcing like that in Figure 35) - one for each of the natural and anthropogenic factors that could have influenced global climate over the past century or so.
SAQ 31
Since the aim is to construct a history of the total radiative forcing of climate, what other natural factor needs to be included in the analysis?
Answer
It should also include the history of volcanic forcing; i.e. the significant, though episodic and transient, negative forcing (cooling effect) from major volcanic eruptions.
In fact, volcanic activity was particularly strong at the end of the 19th century (e.g. the Krakatau eruption in 1883), and again since 1963 (culminating in the Pinatubo eruption in 1991; Figure 14, Section 1.5). By contrast, the first half of the 20th century was a quiet period for the major events that inject large amounts of volcanic aerosol into the stratosphere.
SAQ 32
Look back at Figure 24a. Does the influence of the Pinatubo eruption show up in that record?
Answer
The annual values do indeed show a downturn in GMST in the years following this eruption (especially 1992 and 1993), so it is tempting to answer with a resounding 'yes'.
Here, detailed analysis has confirmed this conclusion. In general, though, we should again be wary of jumping to conclusions. When it comes to the detailed interpretation of the Earth's recent temperature history, we need to be mindful of the influence of yet another natural factor. Even in the absence of an external 'push' provided by radiative forcing, the GMST would not remain constant year after year. Interactions within the climate system generate spontaneous, and inherently unpredictable, fluctuations in global temperature on a variety of time-scales, especially from year-to-year and over periods of a decade or so. This internally generated natural variability is a major source of the 'background noise' we referred to earlier (Section 2.2.2), and will always be superimposed on the global temperature response to any particular pattern of radiative forcing.
So, how do climate scientists assess in a quantitative way how the GMST might have responded to the history of radiative forcing over the past century - and thus gain a deeper insight into the underlying causes of the observed temperature changes? This is where climate modelling studies come into the picture.
