
1.6 The human impact on the atmosphere: the coming of the industrial age
There is no doubt that CO2 is accumulating in the atmosphere. The record from Mauna Loa charts a continuing rise in CO2 concentration since measurements began in 1958, when the level was 315 ppm; the value had reached about 370 ppm by the end of the 20th century, and hit more than 378 ppm in 2004. Important as changes in atmospheric CO2 undoubtedly are (see below), we need to be aware that this is not the whole story of human-induced greenhouse forcing. In particular, monitoring programmes established during the 1980s reveal an upward trend in the levels of two other natural greenhouse gases as well - methane (CH4) and nitrous oxide (N2O). But how do we know that the build up of all three gases over recent decades is due to human intervention?
One strong line of evidence that it is comes from an unlikely source - the vast ice sheets of Greenland and Antarctica. As glacier ice is formed by compaction of successive layers of snow, small bubbles of air become trapped. When a sample of ice is drilled out (Figure 15), these air bubbles can be dated quite accurately, and when analysed, provide an archive of past atmospheric composition - including the levels of CO2, CH4 and N2O. Figure 16 (adapted from IPCC, 2001a) sets the current situation in the context of ice-core data that trace variations in the atmospheric concentrations of these three gases over the past millennium.
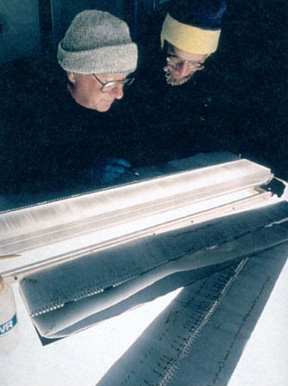
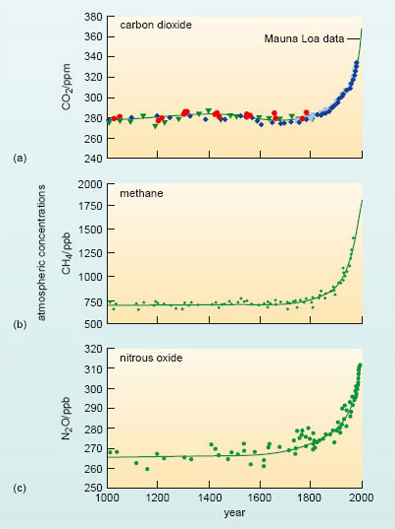
Figure 16 shows changes in the atmospheric concentration of (a) CO2, (b) CH4 and (c) N2O over the past 1000 years. Ice-core data from several sites in Antarctica and Greenland (shown by different symbols in (a)) are supplemented with data from direct atmospheric measurements over recent decades - shown by the line for CO2 (labelled the Mauna Loa data) and included in smoothed curves for CH4 and N2O.
SAQ 15
With this longer-term perspective in mind, what does Figure 16a suggest about the change in atmospheric CO2 during the period covered by the Mauna Loa record?
Answer
It continues a rising trend that seems to have started towards the end of the 18th century. For some 800 years before that, the CO2 level fluctuated little about a mean value close to 280 ppm.
Similar patterns are evident for both methane (Figure 16b) and nitrous oxide (Figure 16c). For each gas, the average level over the first 750 years of these ice-core records (i.e. up to 1750) is taken as a measure of its 'pre-industrial' concentration; these values are collected in Table 2, along with some other pertinent information we shall come on to shortly.
| Concentration | ||||
|---|---|---|---|---|
| Gas | Pre-industrial | 1998 | Atmospheric lifetime/years | Global Warming Potential |
| natural greenhouse gases | ||||
| CO2 | 280 ppm | 368 ppm | ∼100 | 1 |
| CH4 | 700 ppb | 1745 ppb | 12 | 23 |
| N2O | 270 ppb | 314 ppb | 114 | 296 |
| synthetic halocarbons | ||||
| CFC-11(CFCl3) | 0 | 268 ppt | 45 | 4600 |
| CFC-12 (CF2Cl2) | 0 | 533 ppt | 100 | 101600 |
| HCFC-22 (CHF2Cl) | 0 | 132 ppt | 12 | 1700 |
SAQ 16
Using the information in Table 2, calculate the percentage change in the atmospheric concentrations of (i) CO2; (ii) CH4; and (iii) N2O since the pre-industrial period 1750 up to 1998.
Answer
There has been an increase by (i) 31%; (ii) 149%; and (iii) 16%. For CO2, for example, the concentration has increased by (368-280) ppm=88 ppm, so the percentage increase has been (88/280) × 100%=31%. Similar calculations for CH4 and N2O give the other values.
There is one further point to note about the plots in Figure 16. The increase in the atmospheric burden of these gases since pre-industrial times is not linear; rather it appears to be accelerating. For example, it took over 200 years for the level of CO2 to rise from 280 to 330 ppm (1750 to around 1975); it has taken just 30 years for it to increase by the same amount, i.e. a further 50 ppm.
As indicated in the heading to Table 2, these three natural greenhouse gases are described as being 'well-mixed', which means that they are distributed fairly uniformly throughout the troposphere. This is because they persist in the atmosphere long enough to be moved around the world by large-scale air movements and 'mixed up' with other atmospheric constituents, so their concentrations do not vary much from place to place. Current estimates of the atmospheric lifetimes of CO2, CH4 and N2O are also given in Table 2 - along with comparable information for some of the infrared-absorbing halocarbons that do not occur naturally, but are now found in trace amounts in the atmosphere (albeit at the level of only a few tens to hundreds of parts per trillion , ppt; Box 3) as a result of their manufacture and use for various purposes. As a group of compounds, halocarbons can be thought of as derived from hydrocarbons (methane, for the examples in Table 2), but with some or all of the hydrogen atoms in the molecule replaced by halogen atoms - usually some combination of fluorine (F) and chlorine (Cl), as in the chlorofluorocarbons (CFCs) and hydrochlorofluorocarbons (HCFCs).
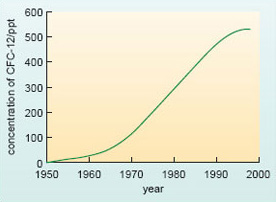
Indicted for their role in stratospheric ozone loss, the use of all CFCs has now been phased out under the evolving provisions of the Montreal Protocol on Substances that Deplete the Ozone Layer (first agreed in 1987). The two main CFCs are included in Table 2 for two reasons. First, these compounds are eventually destroyed by chemical reactions within the atmosphere, but this is a slow process - whence their long atmospheric lifetimes. It will take many decades to remove all trace of these compounds from the atmosphere (e.g. see Figure 17). Secondly, CFCs are also potent greenhouse gases - and so, unfortunately, are many of the other halocarbons (typified by HCFC-22 in Table 2) that have come on stream as CFC-substitutes in some key areas (e.g. refrigeration), and are now building up in the atmosphere. Basically, this can be traced back to the fact that halocarbons tend to absorb strongly at infrared wavelengths within the 'atmospheric window' (Section 1.2.2), where absorption by the natural greenhouse gases is weak.
This point is made more forcibly by the information collected under the heading 'Global Warming Potential' (GWP) in the final column of Table 2. This is a complicated index, designed mainly for use in a policy-making context. Put simply, it is a measure of the radiative forcing induced by adding to the atmosphere a given mass (1 kg, say) of a particular greenhouse gas relative to that induced by adding the same mass of carbon dioxide; this is why the entry for CO2 is '1'. So we can think of the GWP value as a measure of the 'effectiveness' of a greenhouse gas as a climate change agent relative to carbon dioxide - but only on a mass-for-mass basis. This proviso is important. At first sight, the GWP values listed in Table 2 would suggest that CO2 is a relatively weak greenhouse gas; certainly the halocarbons are a factor of at least 103 times more effective, when comparing the release of equal masses of the compounds. The reason CO2 is given such prominence is that humans are responsible for generating so much more of this gas than any other.
SAQ 17
How do the concentration data in Table 2 provide evidence to support this statement?
Answer
In absolute terms (rather than the percentage terms noted above), the increase in atmospheric CO2 has been much greater than that for any of the other greenhouse gases (natural or synthetic); it has risen by close to 100 ppm since pre-industrial times, while the CH4 level, for example, has gone up by around 1000 ppb or just 1 ppm (Box 3).
The atmospheric content of purely synthetic compounds like the halocarbons can be wholly ascribed to human activities. But what about the greenhouse gases that do occur naturally? Atmospheric CO2 is part of the global carbon cycle - and so too is the methane in the atmosphere, though this is probably a less familiar idea. Likewise, N2O is part of the natural nitrogen cycle.
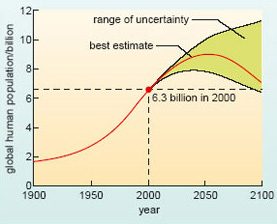
For each of these gases, there are natural processes that release it into the atmosphere (sources), and other natural processes that remove it again (sinks). The relatively stable atmospheric concentrations that prevailed in the pre-industrial world tell us that these sources and sinks were in balance (more or less) at that time. Clearly, this natural balance has been disturbed over the past 200 years or so - a period marked by an explosive growth in the human population. At the end of the 18th century, there were fewer than 1 billion people on the planet; there are over 6.3 billion today, and official estimates suggest that the upward trend is likely to continue for some time to come (Figure 18).
For the most part, the human impact on the atmospheric burden of natural greenhouse gases can be traced back to activities that effectively add a new source of the gas and/or increase natural emissions in various ways. Take CO2, for example. Despite being the feature that characterises the industrial age, burning fossil fuels is not the only anthropogenic source of CO2. For centuries, people have been clearing forests, burning the wood and turning vast tracts of land over to agricultural use in order to feed an ever-expanding population. The process of 'deforestation and land-use change' also adds to the CO2 content of the atmosphere. The range of human activities that have augmented natural emissions of CH4 and N2O are summarised in Box 6, along with a brief comment about another natural greenhouse gas - tropospheric ozone. Study the material in the box, and then work through the following questions.
Box 6 Sources of other greenhouse gases - the human connection
Methane is generated during the breakdown of organic matter by bacteria that thrive in anaerobic (i.e. oxygen-free) environments - principally in waterlogged soils (bogs, swamps and other wetlands, whence methane's common name of 'marsh gas') and in the guts of termites and grazing animals. But today, only some 30% of global CH4 emissions come from natural sources, with natural wetlands accounting for about two-thirds of the total. Rice paddies, effectively artificial marshes, contribute a further 11%, and an astonishing 16% is due to the flatulence of grazing livestock (cattle, sheep, etc.)! While such sources are undoubtedly biogenic in origin, they also clearly have an anthropogenic element - closely linked to human food production, in this case.
Waste management (e.g. organic matter rotting in landfill sites) adds a further anthropogenic source of CH4 (around 17% of global emissions). And since natural gas is mainly methane, so too does leakage from natural gas pipelines and the common practice of venting the gas to the atmosphere at oil production sites and from coal mines (a further 19%). Finally, burning vegetation can also generate CH4, depending on the way it burns (i.e. smouldering as opposed to flaming).
Nitrous oxide is part of the natural nitrogen cycle; it is produced by the activities of micro-organisms in soils and sediments. Again, the increase in its atmospheric concentration is thought to result mainly from agricultural activities, such as the application of nitrogenous fertilisers to boost crop yields; some of the nitrogen ends up in the air as N2O. In addition, the high-temperature combustion of fossil fuels (or indeed, any kind of vegetation) in air produces some N2O (through reaction between N2 and O2 in the air), along with other nitrogen oxides (notably nitric oxide, NO).
Ozone is also a natural component of the lower atmosphere (due in part to transport down from the stratosphere), but the normal background level is low. However, enhanced concentrations of tropospheric ozone are now found in many polluted environments, especially over densely populated industrialised regions. Here, ozone is generated close to the surface by the action of sunlight on the mix of gaseous pollutants that is typically found in vehicle exhaust fumes - unburnt hydrocarbons, carbon monoxide (CO) and nitric oxide (NO). Ozone is one of the more noxious components of 'photochemical smog' , since exposure to enhanced levels of the gas is harmful to both human health and plant growth.
Unfortunately, gains made in reducing vehicle emissions of the key ozone 'precursors' (by fitting catalytic converters) are being outweighed by the worldwide growth in car usage. And there are many other anthropogenic sources of these pollutants as well - including power stations, industrial processes, and the burning of vegetation.
SAQ 18
How does the extraction, distribution and burning of fossil fuels add to the atmospheric burden of other greenhouse gases, as well as CO2?
Answer
It does so both directly (e.g. N2O formed during combustion; CH4 released at fuel extraction sites and through leakage from gas pipelines) and indirectly (emissions of O3 precursors from vehicles and power stations).
SAQ 19
What other activity that is fundamental to human welfare also seems to have played a major role?
Answer
Food production. Agricultural activities increase emissions of both CH4 (rice paddies and livestock) and N2O (fertiliser use). Since burning vegetation often goes along with clearing land for agricultural use, we can add that in as well (a source of CH4, N2O and O3 precursors, as well as CO2).
Unlike the well-mixed greenhouse gases in Table 2, tropospheric ozone is relatively short-lived and there are marked regional variations in its concentration. This has made it difficult to track long-term changes in the total amount of ozone in the troposphere, though recent estimates (reported in the TAR) suggest a significant increase since pre-industrial times, by an estimated 36%.
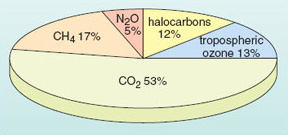
Translating the build up of each of the greenhouse gases into an estimate of the corresponding positive radiative forcing gives the figures collected in Table 3; the relative contributions are shown in a more immediately striking form in the 'pie diagram' in Figure 19. Evidently, the dominant contribution to date has indeed come from the large increase in atmospheric CO2. Nevertheless, the build up of the other gases, coupled with their greenhouse efficiency, means that they too are now playing a significant role as climate change agents; together they account for nearly 50% of the historical greenhouse forcing. This is why the Kyoto Protocol does, in fact, cover a 'basket' of greenhouse gases (including CH4, N2O and halocarbons not included in the Montreal Protocol) as well as CO2. In later discussions focusing chiefly on carbon dioxide, it is important not to forget the additional contributions of the other greenhouse gases.
| Gas | Radiative forcing/W m−2 | % Contribution |
|---|---|---|
| long-lived | ||
| CO2 | 1.46 | 53 |
| CH4 | 0.48 | 17 |
| N2O | 0.15 | 5 |
| halocarbons | 0.34 | 12 |
| short-lived | ||
| tropospheric O3 | 0.35 | 13 |
| total | 2.78 | 100 |
SAQ 20
What other natural greenhouse gas has not been mentioned in this section?
Answer
Water vapour, the most important of all (Section 1.3).
As noted earlier, the water vapour content of the air depends on temperature, and on very little else. The total amount of water vapour in the atmosphere is not directly affected by human actions. However, it can be affected indirectly - and in a way that has important implications for the global climatic response to the build up of other greenhouse gases.
There is also something else to think about in the context of 'the human impact on the atmosphere'. Since the dawn of the industrial age, human activities have been pumping a cocktail of particulate matter, as well as greenhouse gases, into the lower atmosphere. In particular, coal often has a high sulfur content, released as SO2 when the fuel burns (in a power station, industrial process, fireplace, etc.). The 'unpolluted' troposphere naturally contains a certain background level of sulfate aerosols derived from various sulfur-containing gases of both volcanic and biogenic origin. Anthropogenic emissions of SO2 add to the background aerosol load, and that has the same direct radiative effect as the episodic injection of volcanic aerosols into the stratosphere: it increases the back-scattering of solar radiation.
The 'urban haze' typical of many industrialised regions with a high traffic density also contains 'carbon-based' particulate matter derived from fossil-fuel combustion - including droplets of organic compounds, together with varying amounts of black graphitic and tarry carbon particles (collectively known as 'black carbon'). Similar 'carbonaceous' aerosols are found in the dense smoke plumes generated by the large-scale burning of vegetation that occurs on a regular basis in many parts of the world. In some regions, natural wildfires (ignited by a lightning strike) are supplemented by fires set deliberately for forest clearance (e.g. in Amazonia and parts of southeast Asia), or as part of the annual agricultural cycle (e.g. to stimulate a flush of new grass for livestock in the savannah grasslands of southern Africa). Data from satellite-borne instruments (Figure 20) are helping researchers to map the distribution of fine aerosols (whether sulfates or carbonaceous material) typical of anthropogenic sources (Figure 20a) - and to distinguish these from the coarser particles (dust and salt-spray) that have largely natural origins (Figure 20b).
The radiative forcing produced by the build up of well-mixed greenhouse gases is both positive (i.e. it has a warming effect) and occurs everywhere around the globe. The climatic effects of an increased load of tropospheric aerosols are different in three important ways.
Like sulfates, most aerosols are highly reflective, so they effectively increase the planet's albedo, producing a negative forcing (i.e. they cool the surface). Black carbon is an exception to this general rule: it strongly absorbs both incoming sunlight and outgoing longwave radiation, and it is thought that this has a warming effect at the surface.
Anthropogenic aerosols are short-lived in the lower atmosphere (sulfates return to the surface as 'acid rain'), so concentrations vary considerably by region (a pattern evident in Figure 20a) and over time. The radiative effects of an increased load of tropospheric aerosols therefore act on a regional, rather than a truly global, scale.
Anthropogenic aerosols (especially sulfates) also have a potentially important indirect effect on the Earth's radiation balance, linked to their role as cloud condensation nuclei (Section 1.3.2). In polluted regions, the numerous aerosol particles share the condensed water during cloud formation, producing a higher number of small liquid droplets; such clouds are more reflective (i.e. they have a higher albedo), which makes for an additional cooling effect at the surface. This is known as the indirect aerosol effect.
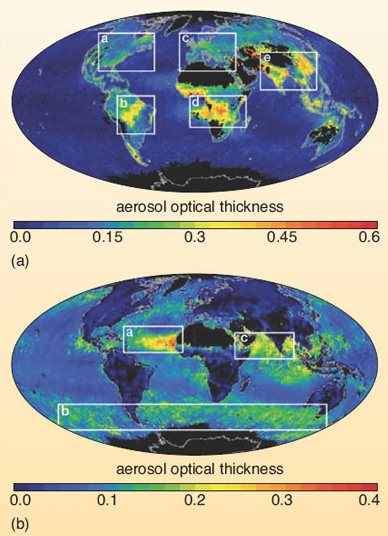
The aerosol optical thickness is a measure of the total aerosol load (in each size group) in the lower atmosphere, and is represented by the colour scale. In Figure 20 the white boxes indicate regions with high aerosol concentrations. (a) The image shows fine particles in pollution from North America, Europe and south and east Asia (regions 1, 2 and 3), and in dense plumes downwind from vegetation fires in South America and southern Africa (regions 4 and 5). (b) The image shows coarse dust from Africa (region 6), salt particles generated in the windy conditions of the Southern Ocean (region 8) and desert dust (region 7).1.
The cooling influence (both direct and indirect) of sulfate aerosols in the troposphere has been appreciated for over a decade: it featured in the first IPCC report in 1990, for example. Research since then has begun to unravel the climatic effects of other anthropogenic aerosols, but the extraordinary diversity of these particles (in size, chemical composition, radiative properties, etc.) means that this is turning out to be another complicated and uncertain part of the climate change puzzle. The general view is that tropospheric aerosols mostly produce negative forcing, but there is little confidence in the ability to quantify the total human-related effect, and the way it has evolved over time during the industrial age.
SAQ 21
Given the fundamental question we highlighted at the end of Section 1.5, why is this an important issue?
Answer
The cooling influence of most anthropogenic aerosols could have acted to mask (i.e. partially offset) the full warming effect of the build up of greenhouse gases since pre-industrial times.
We shall come back to this issue towards the end of Section 2, once we have examined the evidence that the Earth really is warming up.