
2.2.1 Long-term rhythms in the climate
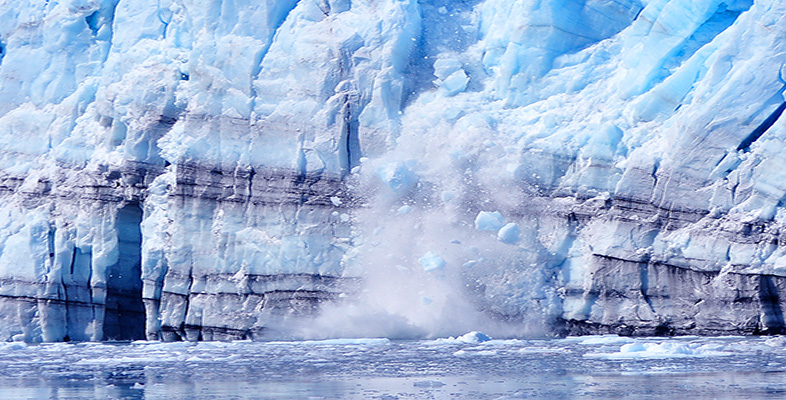
The instrumental record referred to above is based on direct temperature measurements (using thermometers), and extends back only 150 years or so. Temperatures further back in time are reconstructed from a variety of proxy data. These include historical documents, together with natural archives of climate-sensitive phenomena, such as the growth or retreat of glaciers, tree rings, corals, sediments and ice cores (see Box 7). In general, the proxy data record becomes more sparse and more imprecise the further back in time we go. Nevertheless, it has proved possible to produce a reasonably reliable reconstruction of how global temperature has varied throughout most of the Earth's history; this is known as the palaeoclimate record (from the Greek palaios for 'ancient').
Box 7 Proxy data: ways to reconstruct past climates (Stokstad, 2001)
People have recorded the vicissitudes of climate and their impact on human affairs for centuries, so archaeological inscriptions and historical documents (diaries, ship's logs, etc.) are a valuable, if somewhat anecdotal, source of climate information. In addition, a variety of techniques - ranging from counting pollen types in lake sediments to analysis of isotope ratios in ancient ice (recall Figure 15)- yields rich, if sometimes ambiguous, climate information from many natural sources.
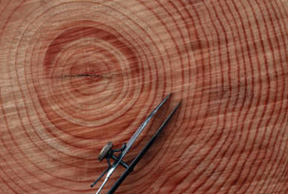
For example, dendroclimatology depends on the fact that trees in many parts of the world experience an annual growth cycle (Figure 22). Each year's growth (the thickness and/or density of a ring) depends on the local temperature and moisture conditions, creating a unique record that can then be matched with overlapping records from other trees to produce longer time series. Annual records typically go back 500 to 700 years. In a few cases, the preservation of fossil trees has allowed continuous records from 11 000 years ago to the present to be constructed.
In a similar way, cyclical responses lead to annual banding in corals, which can provide information about sea-surface temperatures, sea level and other ocean conditions - typically back to some 400 years ago.
Layered sediments on lake and ocean floors are another rich source. The types of pollen trapped in lake sediments reveal shifting patterns of vegetation, and thus indirect information about temperature and moisture conditions. Records can go back some 100 000 years. In marine sediments, analysis of microfossils can provide data on seawater temperature and salinity (salt content), atmospheric CO2 and ocean circulation. Less common deposits of coarse debris can point to the break up of ice sheets and the release of detritus from melting icebergs. Marine sediments provide information from time periods ranging from 20 000 years to 180 million years ago.
Finally, long ice cores drilled out of the Greenland and Antarctic ice sheets yield a wealth of information. For example, past temperatures can be determined by oxygen isotope analysis . 99% of the oxygen on Earth is the isotope 16O; most of the rest is 18O. Because water molecules containing the different isotopes (i.e. H216O and H218O) have slightly different physical properties, it turns out that the 18O/16O ratio in ice locked up on land is affected by the ambient temperature at the time when the ice formed. Thus, fluctuations in the oxygen isotope ratio in an ice core provide a proxy for temperature changes back through time (see Figure 23). The cores also include atmospheric fallout such as wind-blown dust, volcanic ash, pollen, etc. - along with trapped air bubbles (as discussed in Section 1.6).
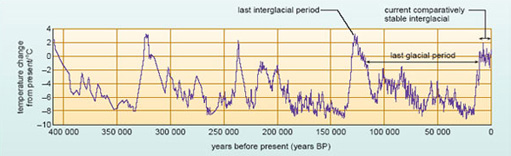
This record tells us, for example, that the Earth entered into the most recent comparatively cold period of its history (known as the Pleistocene Ice Age) around 2.6 million years ago. On a geological time-scale, these Ice Ages are relatively rare, covering only 2-3% of the history of our planet. The characteristic feature of the current one (and there is no reason to suppose that it is finished) is evident in Figure 23. Drilled in Antarctica, the Vostok ice core provides a temperature record that goes back several hundreds of thousands of years. Beyond about 10 000 years ago, it tells a story of an unstable climate oscillating between short warm interglacial periods and longer cold glacial periods about every 100 000 years - with global temperatures varying by as much as 5 to 8 °C - interspersed by many more short-term fluctuations.
By contrast, global temperatures over the last 10 000 years or so seem to have been much less variable, fluctuating by little more than one or two degrees. In short, the interglacial period in which we live, known as the Holocene, appears (on available evidence) to have provided the longest period of relatively stable global climate for at least 400 000 years. It is almost certainly no coincidence that this is also when many human societies developed agriculture and when the beginnings of modern civilisations occurred. We now shift the focus to the more recent past - the period during which human population growth and the coming of the industrial age began to make their mark on the composition of the atmosphere.