

6 Questions for review and discussion
Question 1
Complete the following sentences by selecting the correct word or phrase from the list below to fill in the spaces:
| independent |
| dependent |
| positive |
| negative |
| Giffen |
| Veblen |
| slope downwards from left to right |
| slope upwards from left to right |
| are horizontal |
| are vertical |
| are indeterminate |
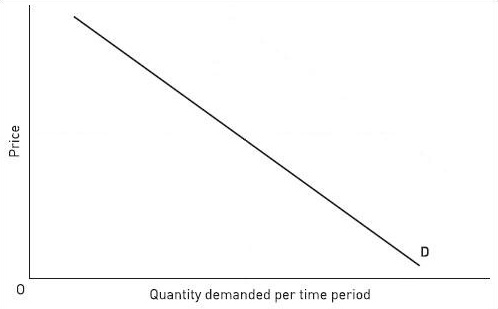
A market demand curve shows the relationship between quantity demanded (the ……… variable) and price (the ……… variable). According to the ‘law of demand’, this relationship will be a ……… one. Some luxury goods called ……… goods, and some very basic goods, called ……… goods, are exceptions to the ‘law of demand’, and their market demand curves ………
Answer
A market demand curve shows the relationship between quantity demanded (the dependent variable) and price (the independent variable). According to the ‘law of demand’, this relationship will be a negative one. Some luxury goods called Veblen goods, and some very basic goods, called Giffen goods, are exceptions to the ‘law of demand’, and their market demand curves slope upwards from left to right.
Question 2
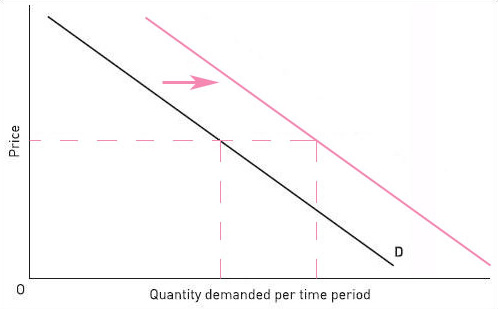
Figure 11 shows a hypothetical demand curve for cartridge pens. Draw a shift in the curve leftwards or rightwards as appropriate to illustrate the likely effect of each of the following:
(a) An increase in the price of fibre-tipped pens
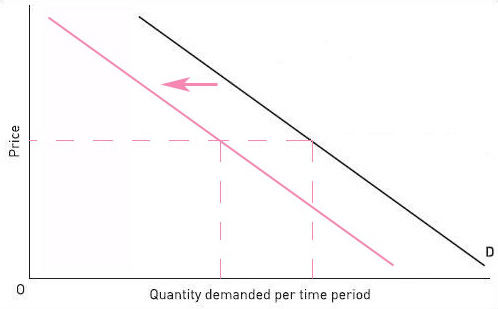
(b) An increase in the price of ink cartridges
Answer
(a)
(b)
Question 3
Say which is the most appropriate phrase to complete the sentence below:
A firm is operating in the short run when…
(a) It cannot change the quantity it uses of any of the factors of production, so some inputs are being wasted.
(b) It is suffering diminishing returns to its fixed and variable factors.
(c) There is not sufficient time for it to raise its output.
(d) It cannot change the quantity it uses of at least one of its factor inputs.
Answer
(c) There is not sufficient time for it to raise its output.
Question 4
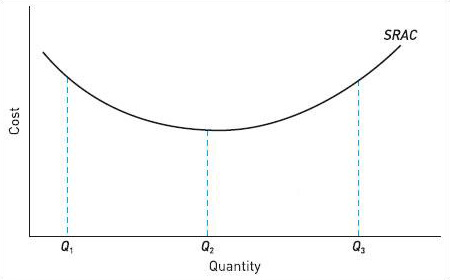
Figure 12 shows a short-run average cost curve for a firm. Select two statements from the list below. The statement you mark ‘1’ should state what happens as output rises from Q1 to Q2. The statement you mark ‘2’ should state what happens as output rises from Q2 to Q3.
Note: ‘average’ means ‘per unit of output’.
(a) Average fixed cost falls, average variable cost falls then rises.
(b) Falling average variable cost outweighs rising average fixed cost.
(c) There are diminishing returns to the variable factors throughout.
(d) Average fixed cost and average variable cost both rise.
(e) There are increasing returns to the variable factors throughout.
Answer
(a) Average fixed cost falls, average variable cost falls then rises.
(c) There are diminishing returns to the variable factors throughout.
Question 5
Figure 13 shows long-run average cost curves for two firms, A and B, each in a different industry. Select from the list of statements below the one that is consistent with what is shown in the diagram.
(a) Firm A attains minimum efficient scale (MES) at a lower level of output than Firm B.
(b) Both firms experience diseconomies of scale at the highest levels of output shown.
(c) Firm A operates in an industry where there is great pressure to expand output, for example by merger.
(d) Firm B has higher fixed costs than Firm A.
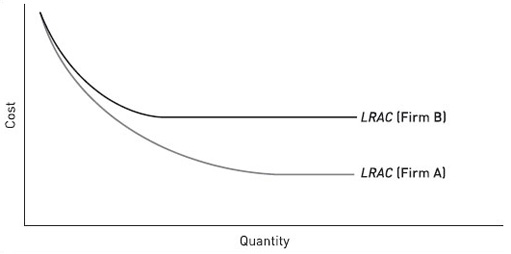
Answer
(c) Firm A operates in an industry where there is great pressure to expand output, for example by merger.
Question 6
Figure 14 shows a learning curve for a firm. The curve is similar in shape to a long-run average cost (LRAC) curve, but the relationship it depicts is different. Select from the list below the three statements that correctly identify differences between curves of these two kinds:
(a) The horizontal axis of the learning curve shows cumulative output; that of the LRAC curve shows output per time period.
(b) The costs shown by the learning curve exclude capital costs; those shown by the LRAC curve include capital costs.
(c) The firm moves rightwards along its learning curve over time; the firm may move leftwards or rightwards along its LRAC curve.
(d) At some points on the learning curve, factor inputs are being wasted owing to mistakes and inexperience; at all points on the LRAC curve, the firm uses all inputs to their full potential and there is no waste.
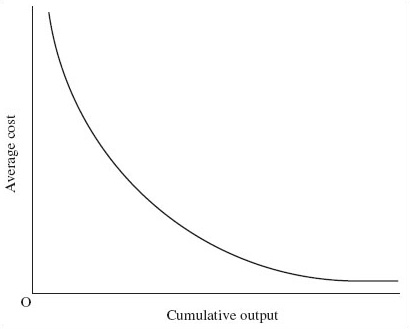
Answer
(a) The horizontal axis of the learning curve shows cumulative output; that of the LRAC curve shows output per time period.
(c) The firm moves rightwards along its learning curve over time; the firm may move leftwards or rightwards along its LRAC curve.
(d) At some points on the learning curve, factor inputs are being wasted owing to mistakes and inexperience; at all points on the LRAC curve, the firm uses all inputs to their full potential and there is no waste.
Question 7
Complete the following sentences by selecting words or phrases from the list below.
| representative |
| competence-enhancing |
| mature |
| distinct competencies |
| competence-destroying |
| manufacturing |
| network |
| reproduce competencies |
In analysing the costs, technology and output of firms, we can use a model of a ……… firm. But when thinking about innovation, we need to model firms as diverse organisations that develop ………
……… innovations tend to cause market structure to become more concentrated. The need to secure quick benefits from learning effects is particularly acute in ……… industries.
Answer
In analysing the costs, technology and output of firms, we can use a model of a representative firm. But when thinking about innovation, we need to model firms as diverse organisations that develop distinct competencies.
Conpetence-enhancing innovations tend to cause market structure to become more concentrated. The need to secure quick benefits from learning effects is particularly acute in network industries.
Question 8
The table below gives information about a firm's costs in the short and long run.
| Output (000s) | ||||||||||||||
|---|---|---|---|---|---|---|---|---|---|---|---|---|---|---|
| 1 | 2 | 3 | 4 | 5 | 6 | |||||||||
| Short-run average cost (£) | 18 | 9 | 9 | 11 | 14 | 14 | ||||||||
| Long-run average cost (£) | 18 | 6 | 5 | 5 | 5 | 6 | ||||||||
(a) Draw a diagram showing each of the above curves and explain briefly what distinguishes the short run from the long run.
(b) With reference to the diagram, explain how (i) diminishing returns and (ii) diseconomies of scale affect the production costs of a firm.
(c) With reference to the diagram, give an example of a change which can cause (i) a movement along the long-run curve and (ii) a shift of the long-run curve.
Question 9
Essay: Using examples, explain how network externalities and economies of scale interact to determine industrial structure.