

Image bank
This is Watching the weather's image bank. If you want to return to the unit, please click here.
This is Watching the weather's image bank. If you want to return to the unit, please click here.
records 1 - 10 of 38
| image title | 3-day sequence of infrared images from Meteosat SEVIRI |
| caption | A sequence of infrared images taken from the geostationary satellite Meteosat SEVIRI (placed over the Greenwich Meridian, longitude 0°) once every three hours over a period of three days from 1800 UTC on 29 April 2008 onwards. Mid-latitude weather systems can be seen to move predominantly from west to east and the growth of convective cloud activity in equatorial regions is clear around mid-day and into the afternoon (roughly 1200-1800 UTC if looking at the centre of the image). Since the satellite is placed over the Greenwich meridian, the UTC corresponds to local time of day directly below the satellite. |
| code | MI022 |
| Section | Meteorological instruments |
| Subsection | Satellites |
| image credit | © 2007 EUMETSAT |
| thumbnail | 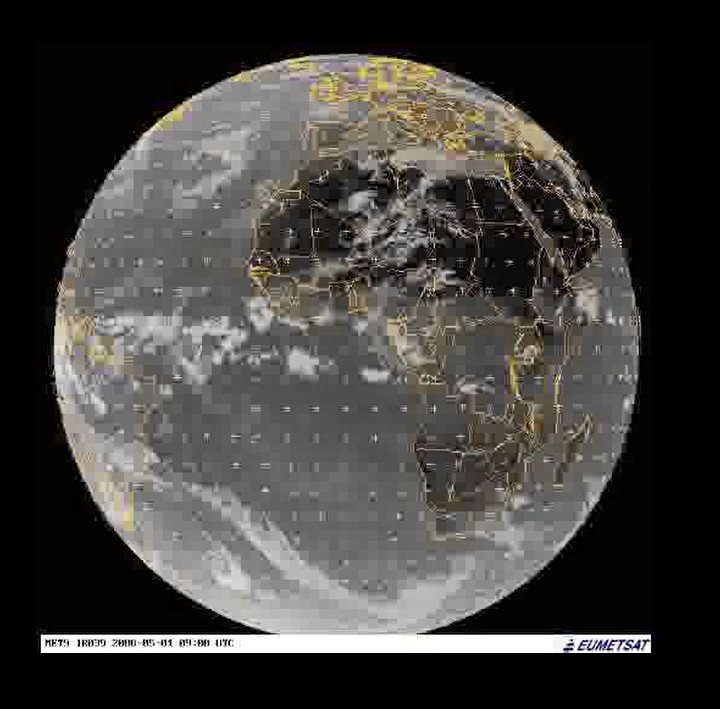 |
| File | |
| image title | 3-day sequence of visible images from Meteosat SEVIRI |
| caption | A sequence of visible images taken from the geostationary satellite Meteosat SEVIRI (placed over the Greenwich Meridian, longitude 0°) once every three hours over a period of three days from 1800 UTC on 29 April 2008 onwards. Mid-latitude weather systems can be seen to move predominantly from west to east and the growth of convective cloud activity in equatorial regions is clear around mid-day and into the afternoon (roughly 1200-1800 UTC if looking at the centre of the image). Since the satellite is placed over the Greenwich meridian, the UTC corresponds to local time of day directly below the satellite. A grey globe is shown in frames when there is no visible image available, normally at 0000 UTC, when the Sun is on the opposite side of the Earth to the satellite and there is no illumination at visible frequencies. |
| code | MI020 |
| Section | Meteorological instruments |
| Subsection | Satellites |
| image credit | © 2007 EUMETSAT |
| thumbnail | 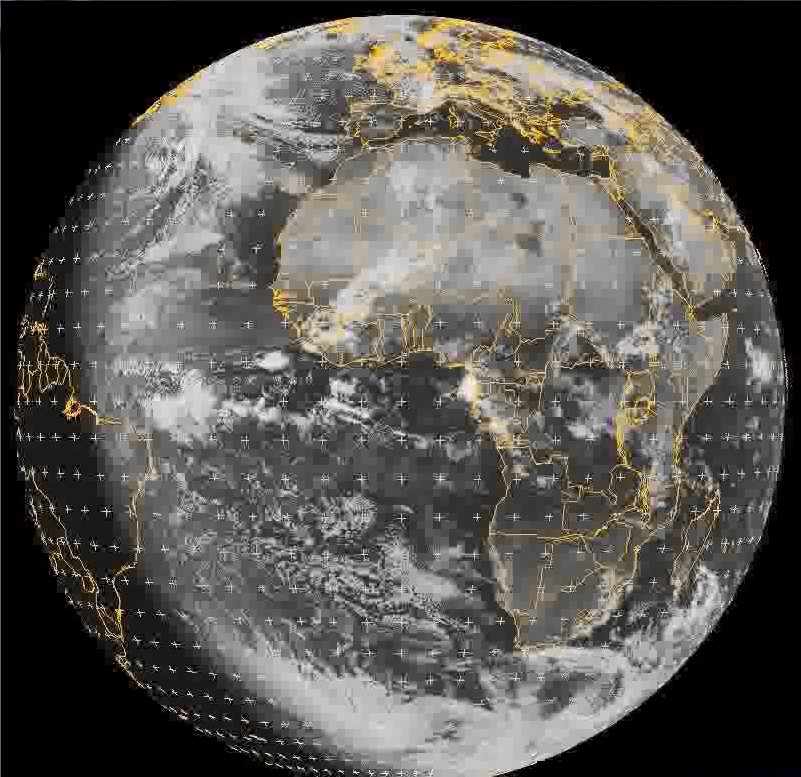 |
| File | |
| image title | 3-day sequence of water vapour images from Meteosat SEVIRI |
| caption | A sequence of water vapour images taken from the geostationary satellite Meteosat SEVIRI (placed over the Greenwich Meridian, longitude 0°) once every three hours over a period of three days from 1800 UTC on 29 April 2008 onwards. Mid-latitude weather systems can be seen to move predominantly from west to east and the growth of convective cloud activity in equatorial regions is clear around mid-day and into the afternoon (roughly 1200-1800 UTC if looking at the centre of the image). Since the satellite is placed over the Greenwich meridian, the UTC corresponds to local time of day directly below the satellite. |
| code | MI024 |
| Section | Meteorological instruments |
| Subsection | Satellites |
| image credit | © 2007 EUMETSAT |
| thumbnail | 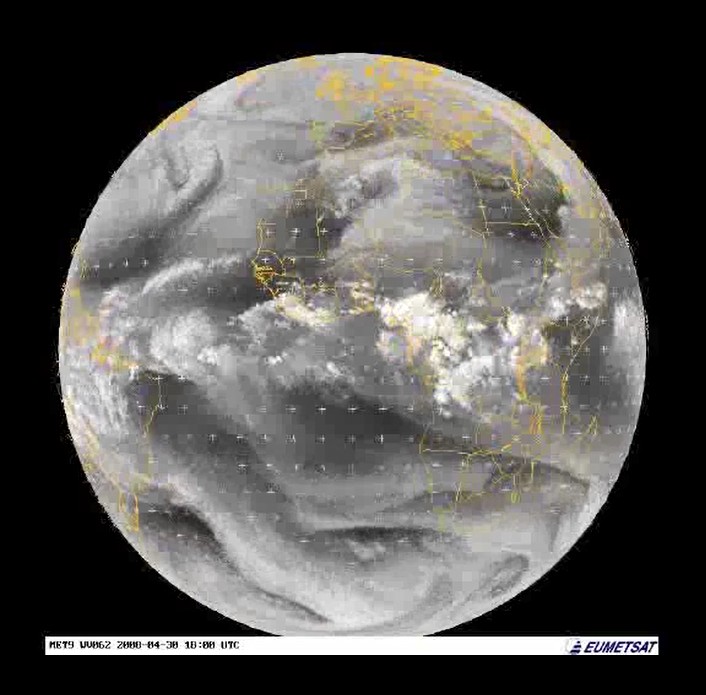 |
| File | |
| image title | 5-day sequence of infrared images from GOES East |
| caption | A sequence of infrared images taken from the geostationary satellite GOES East (placed over the east coast of America, longitude 75° W) once every three hours over a period of five days from 0000 UTC on 18 August 2007, the day that Hurricane Dean reached Category 5 status as it crossed the Atlantic and eventually hit the Yucatan peninsula. |
| code | MI028 |
| Section | Meteorological instruments |
| Subsection | Satellites |
| image credit | © 2007 EUMETSAT |
| thumbnail | 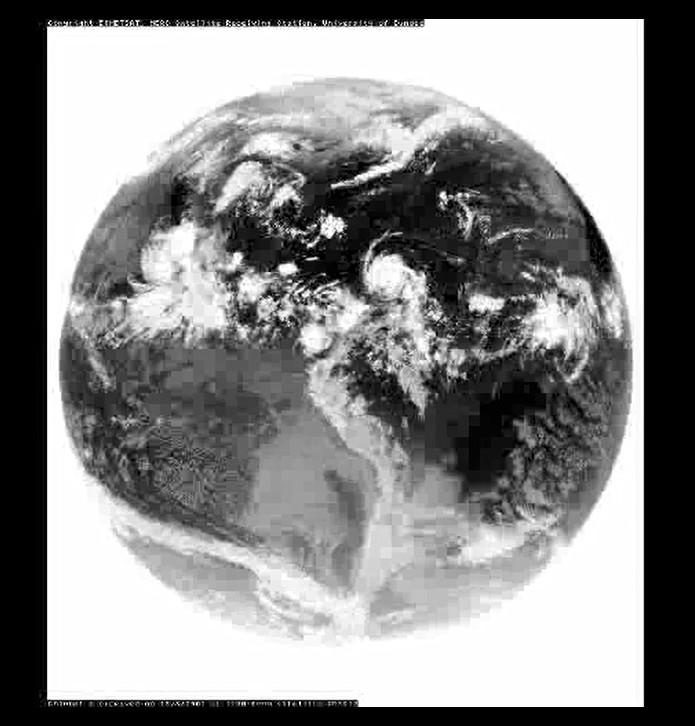 |
| File | |
| image title | 5-day sequence of visible images from GOES East |
| caption | A sequence of visible images taken from the geostationary satellite GOES East (placed over the east coast of America, longitude 75° W) once every three hours over a period of five days from 0000 UTC on 18 August 2007, the day that Hurricane Dean reached Category 5 status as it crossed the Atlantic and eventually hit the Yucatan peninsula. The images at 0300 UTC, 0600 UTC and 0900 UTC are not included in the satellite archive since the hemisphere was in darkness during this time, but blank images have been added to keep the time interval between images regular at three hours per frame. This illustrates one of the disadvantages of visible imaging. |
| code | MI026 |
| Section | Meteorological instruments |
| Subsection | Satellites |
| image credit | © 2007 EUMETSAT |
| thumbnail | 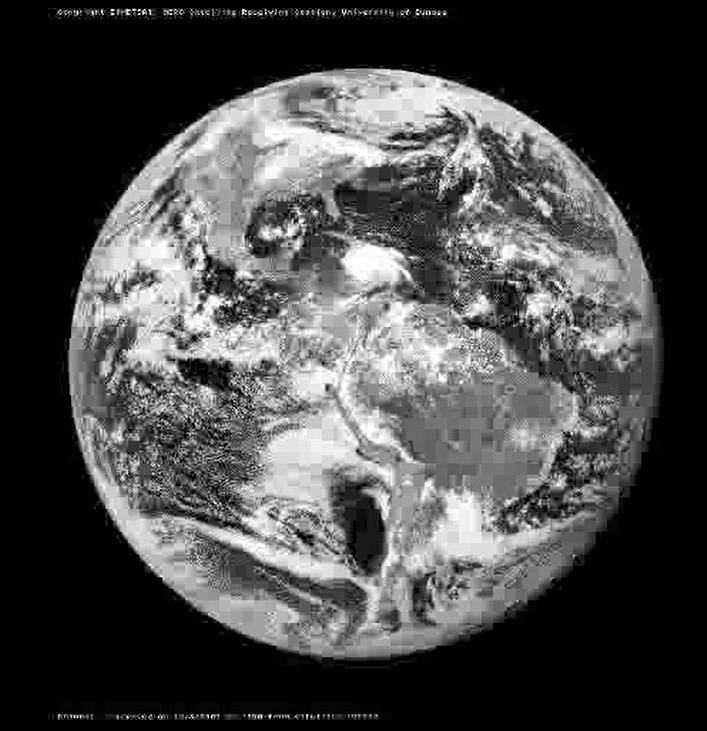 |
| File | |
| image title | 5-day sequence of water vapour images from GOES East |
| caption | A sequence of water vapour images taken from the geostationary satellite GOES East (placed over the east coast of America, longitude 75° W) once every three hours over a period of five days from 0000 UTC on 18 August 2007, the day that Hurricane Dean reached Category 5 status as it crossed the Atlantic and eventually hit the Yucatan peninsula. |
| code | MI030 |
| Section | Meteorological instruments |
| Subsection | Satellites |
| image credit | © 2007 EUMETSAT |
| thumbnail | 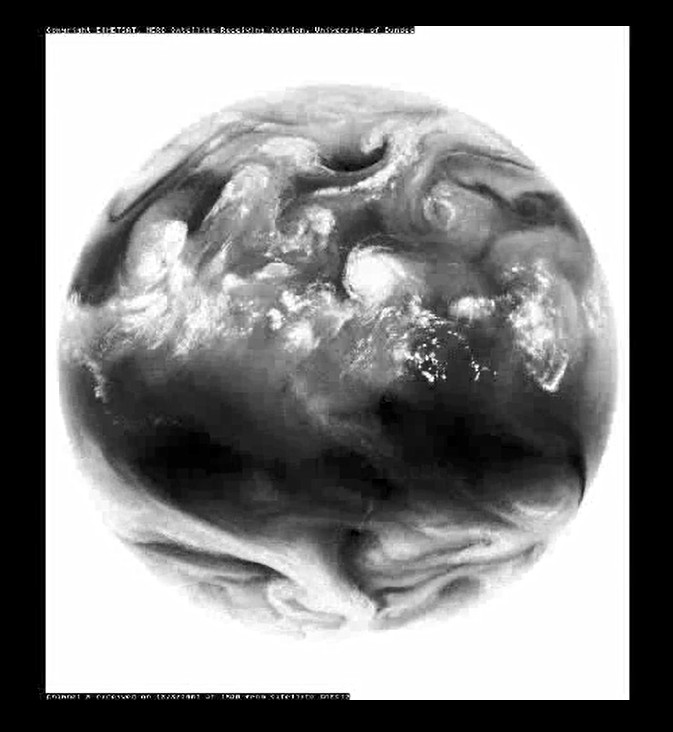 |
| File | |
| image title | Infrared image from GOES East |
| caption | An infrared (IR) image taken from the geostationary satellite GOES East (placed over the east coast of America, longitude 75° W) at 1200 UTC on 20 August 2007. The outlines of countries are overlaid and there is also a grid of reference marks (+). Over the disk of the Earth, lighter colours have been used to indicate colder temperatures, as is conventional in IR images, and space is coloured white as the coldest part of the image. The high, cold clouds above Hurricane Dean and other tropical systems are especially apparent, as is a swirl of high cloud associated with a North Atlantic weather system. |
| code | MI027 |
| Section | Meteorological instruments |
| Subsection | Satellites |
| image credit | © 2007 EUMETSAT |
| thumbnail | 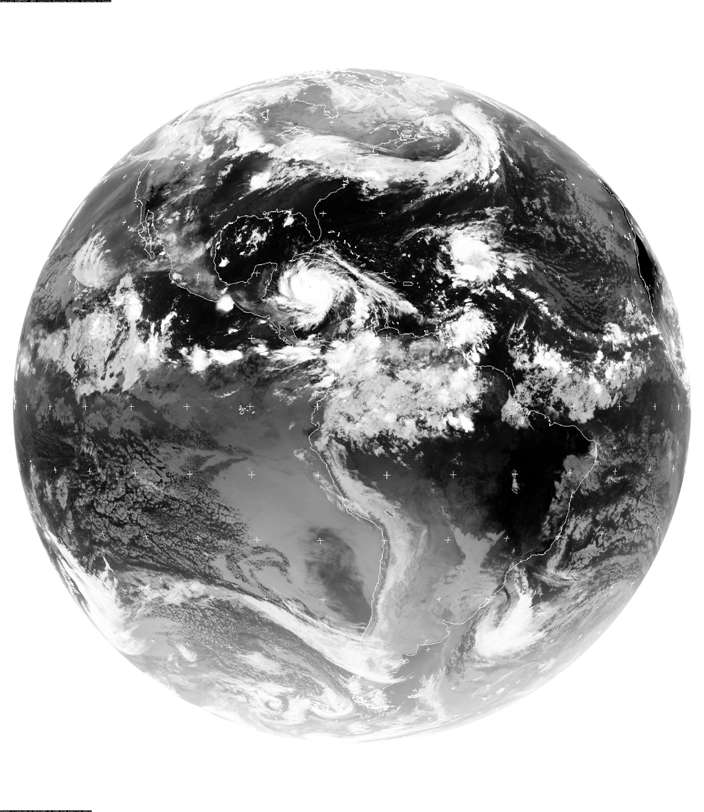 |
| File | |
| image title | Visible image from GOES East |
| caption | A visible image taken from the geostationary satellite GOES East (placed over the east coast of America, longitude 75° W) at 1200 UTC on 20 August 2007. The outlines of countries are overlaid and there is also a grid of reference marks (+). This image is illuminated by sunlight and the brightness indicates the amount of light that has been scattered back to the satellite; clouds appear white and the oceans (where cloud-free) appear darker than the land. Dawn is just breaking in the Caribbean, where Hurricane Dean, a Category 5 storm, can be seen between Cuba and Central America. |
| code | MI025 |
| Section | Meteorological instruments |
| Subsection | Satellites |
| image credit | © 2007 EUMETSAT |
| thumbnail | 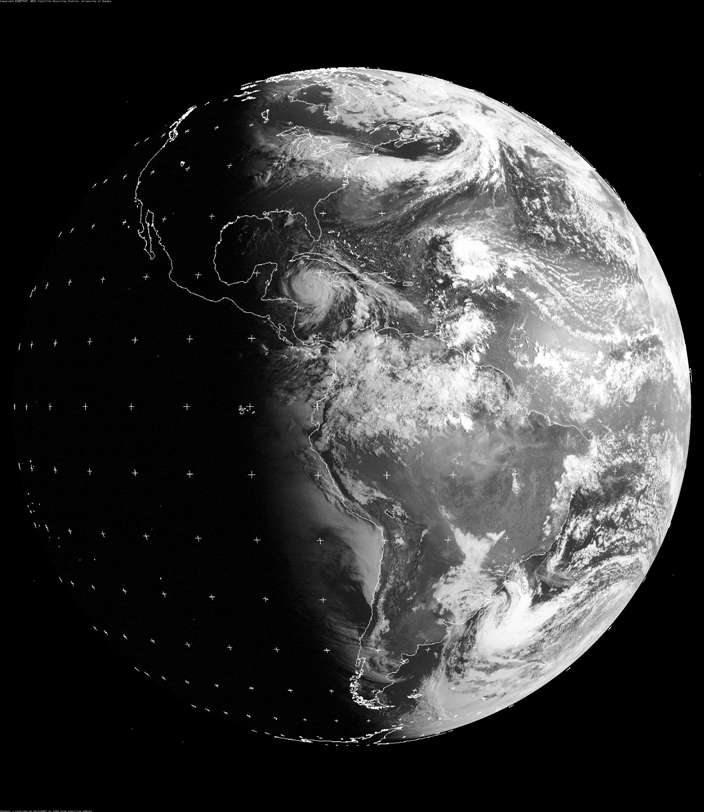 |
| File | |
| image title | Meteorological research plane |
| caption | The Facility for Airborne Atmospheric Measurements (FAAM) is an aircraft operated jointly by the UK Met Office and the UK National and Environmental Research Council. Onboard instruments include systems for recording of pressure, temperature, relative humidity, wind speed and direction, atmospheric pollutants and the liquid water content of clouds. It is involved in a wide range of research activities relating to atmospheric measurements and monitoring. |
| code | MI037 |
| Section | Meteorological instruments |
| Subsection | Balloons, aircraft and radar |
| image credit | © BAES Systems 2003 |
| thumbnail |  |
| File | |
| image title | Radar detection of precipitation |
| caption | This image shows a composite precipitation image from weather radar networks in the Nordic region of Europe. The overlapping circular areas correspond to the coverage of individual stations (this is often called their 'footprint'). There are 30 weather radar stations in Norway, Sweden, Denmark, Finland and Estonia and data sharing among them generates a composite image in real time, which is updated every two hours. Notice the colour scale that shows the intensity of the precipitation. |
| code | MI038 |
| Section | Meteorological instruments |
| Subsection | Balloons, aircraft and radar |
| image credit | courtesy Swedish Meteorological and Hydrological Institute |
| thumbnail | 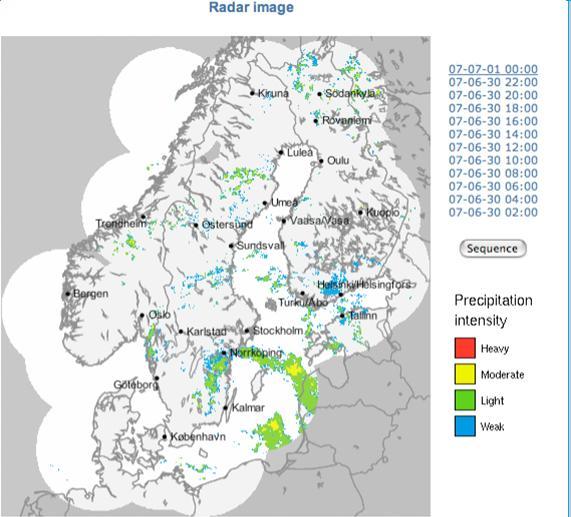 |
| File | |