How do we measure sustainability?
The wide range of definitions for sustainability also applies to how it is measured. Sustainability may cross environment, socio-economic, governance and even health and welfare as the “One Health” concept becomes more prominent. It may also include impacts at local, regional and global levels. To appreciate all of these aspects, a comprehensive method of assessment is required. It is extremely challenging to incorporate all of the different aspects and contexts into a single metric or index of sustainability.
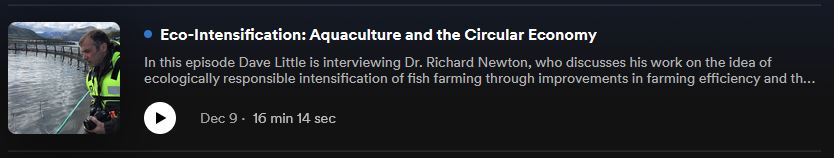
Before continuing with this unit, you might wish to listen to this podcast discussion between Professor Dave Little and Dr Richard Newton on Eco-intensification and the circular economy as it provides further context for the methods presented here. Listen directly using the player below, or link to the Podcast website for additional information.
Download this audio clip.Audio player: EcoIntensive_HotFish008.mp3
As
shown in previous modules, impacts occur and accumulate throughout aquaculture
value chains (Figure 1). Life Cycle Assessment (LCA) has emerged as a
transferable tool for accounting for the supply chain emissions of products and communicating
them as tangible environmental impacts. The broad supply chain approach ensures
that trade-offs and shifts in impacts are identified. There have also been
attempts to integrate socioeconomic impacts using an approach although data
collection for these types of impacts can be especially challenging. LCA
typically involves a large data set, sourced from producers, literature and LCA
databases which needs careful planning. Steps set out by ISO (2006a; 2006b) are
designed to aid practitioners to plan data collection and modelling and are
described in Figure 2.
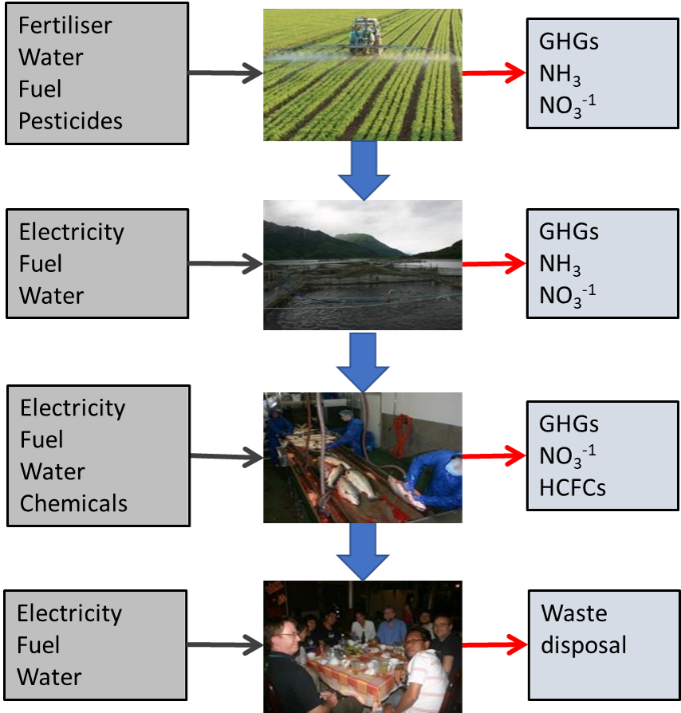
Figure 1. Schematic representation of an aquaculture value chain with raw material inputs and emissions
The Goal and Scope phase sets out the basic parameters of the study and is usually dictated by the audience and main objectives, such as commercial product development, planning or marketing exercise, or an academic, independent assessment aimed at policymakers or others. This determines how the results will be used and presented, and their application.
Critical points to be defined during the Goal and Scope are the boundaries of the system, i.e. what parts of the value chain are to be included in the data collection, the reference unit (known as the “Functional Unit”) for the study, the cut-off criteria (what processes will be included or not, usually based on their relative contribution to overall impact), the partitioning procedure between multi-functional processes (how much impact should be attributed to different co-products), the impact categories that will be included and the analytical method.
Inventory analysis involves the compiling
of all relevant input and output data of the production systems within the
value chain under study, within the boundaries defined at the Goal and Scope
phase into the “Life Cycle Inventory” (LCI). It is generally the most
time-consuming part of the LCA as it involves complex survey work with multiple
stakeholder actors, many of which may not have been previously identified. It
is an iterative process that often requires trust and confidence-building
between the data collectors and providers, especially as the data is often
commercially sensitive.
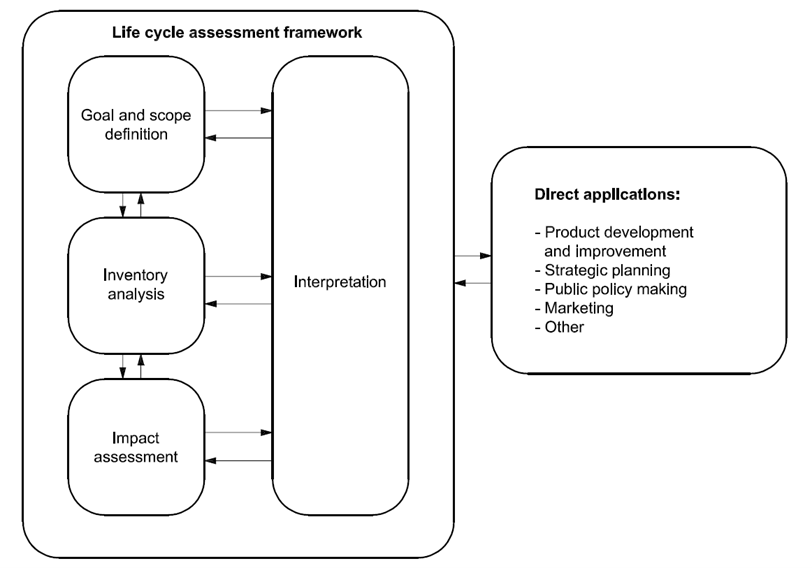
Figure 2. Overview
of Life Cycle Assessment steps according to ISO 14040 (ISO 2006a)
Often the first step is to characterise the systems and flows of materials and value by constructing flow diagrams. Information can be gathered from any previous studies of similar systems and by stakeholder interaction. The flow diagrams provide an initial basis for understanding the most important parts of the value chain and their interconnectivity to inform primary data collection and where the cut-off points might be. The data can be used to determine how many of each stakeholder must be contacted to provide a representative level of data that meet the goal and scope objectives.
The Life Cycle Inventory may be separated into
three parts: 1; primary data that are collected directly from stakeholders via
survey or other means, 2; secondary data that are collected by literature
searches and 3; background data that are contained within LCA databases such as
EcoInvent (https://ecoinvent.org/). Typically, primary data are those relating
directly to the system under study, such as the farm, feed manufacturers, and
processors in the case of aquaculture. It usually includes things like the
amount of feed or electricity used and the composition of the feed. Secondary
data may include more detail on items within the primary data such as on the
growing and manufacture of feed ingredients. As ingredients are often produced
in other continents, it is not feasible to collect primary data for these
processes within the same project. Background data typically include things
like emissions data from engines, energy provision, chemical production, and
raw materials for capital goods such as steel etc that are entries into the
primary or secondary data list. Such background data have been built up and
adjusted over many years by experts in those fields. Data collection is usually
a lengthy and iterative process that goes through an initial cleaning and
quality evaluation process before contacting participants for clarification of
data or further data collection. Data collection from primary sources requires
good relationships with the industry sector from where the data are collected,
which may need to be built through a series of meetings, perhaps facilitated by
strong partners that already have good working relationships within the
industry. Literature data must be found and analysed to identify the required
data. Often several data sources may be available with conflicting information
that must be assessed for its suitability and cleaned to the required level. Data must be
adjusted to take into account the reference flows within the study set out
within the Goal and Scope phase. Other data such as country-specific
electricity mixes and the associated emissions may be sourced from extensive
LCA databases, including e.g. EcoInvent. Data must be further assessed for
quality and representativeness throughout the data collection period. During
the data evaluation steps, the data categories are identified and quantified
into the reference flows of materials, energy and value between the process
nodes within the value chain according to the initial flow diagrams. The data
includes economic flows, which are generally goods or services that have an
economic value, produced in manufacturing processes, or environmental flows
which are either raw material resources or emissions taken from or emitted to
the biosphere.
It is rarely possible to collect
data on all processes in the life cycle of a product and it saves a lot of time
to determine those processes which have little effect on the overall impact
assessment early on after the initial data scoping. Reducing the level of data
collection and hence the time commitments also improves the relationship with
the industry from which it is being collected. In most cases, the cut-off
criteria will be according to impact contribution (e.g. processes that
contribute to less than 1% of emissions are excluded), but processes may also
be assumed if there is little access to data or likelihood of obtaining it. In
such cases, assumptions must be made according to similar processes in similar
systems.