Fish In Fish Out Ratios
Concerns around marine ingredients use in aquaculture was raised by Naylor et al. (2000) who first used the “Fish In: Fish Out” (FIFO) metric as an efficiency rating for how many tonnes of wild fish were embodied within the feed required to produce fish from aquaculture. Although there have been different forms of the metric, it is now adopted within all of the major certification standards for aquaculture BAP (2020); ASC (2021); GlobalGAP (2021).
Early versions were criticised by
the aquaculture and marine ingredients industries because they overestimated
the use of marine ingredients from a global supply chain perspective. As the
proportions of meal and oil yielded from rendering are different to the
inclusion rates in feed, there would always be some “spare”, which was not
taken into account within the early calculations. As different species were
calculated in isolation, there was double counting of utilisation which did not
reflect global supply volumes. Some forms of FIFO are estimated based on the
limiting ingredient such as the “forage fish dependency ratio” as a single
issue, while others such as the Jackson (2009)
method or economic FIFO take a global supply chain efficiency perspective that
can also be integrated with other metrics within Life Cycle Assessment and
compared to other impact categories using the same methodology (Kok et al., 2020). Typically, the FIFO
calculations are taken as a function of the yield of marine ingredients
obtained from the fish raw material, the inclusion of marine ingredients within
aquafeed and the feed conversion ratio (FCR) to aquaculture product. Some
examples are as follows.
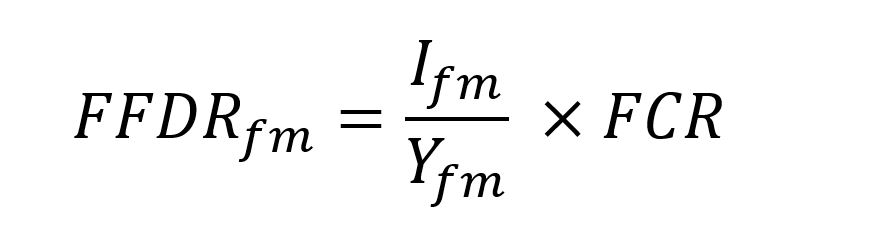
Equation 1 Forage fish dependency ratio (fish meal) FFDRfm where I is the inclusion rate and Y is the rendering yield for fish meal (fm)
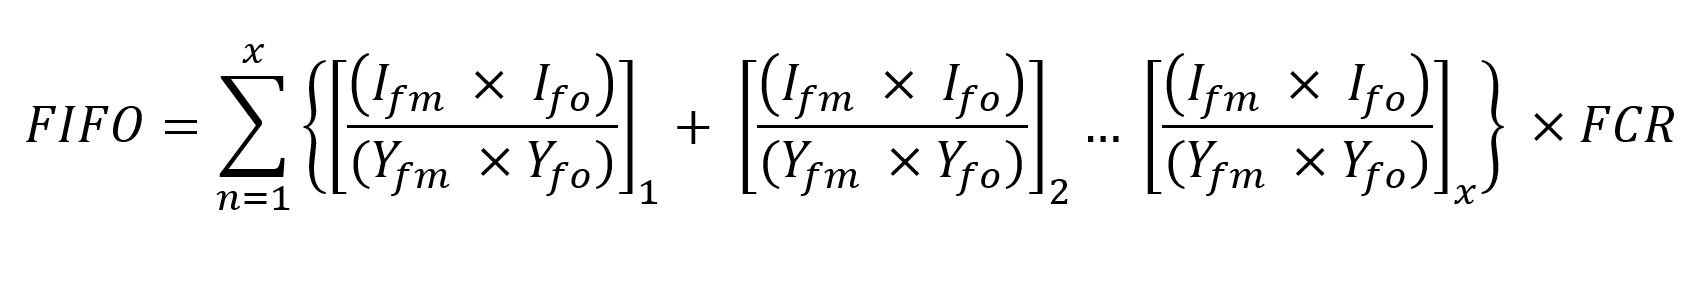
Equation 2 Fish In: Fish Out (Jackson 2009) fm = fish meal, fo = fish oil for marine ingredients 1 to x
Equation 3a economic Fish In: Fish Out (eFIFO) where PF is the price factor (Equation 3b) and BPF is the By-product factor (Equation 3c)
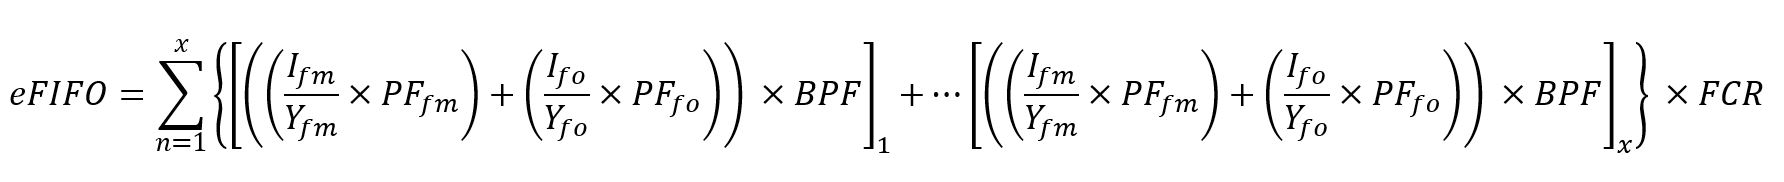
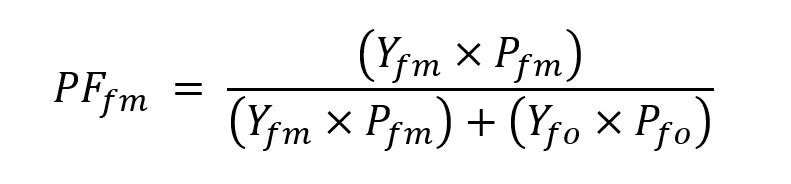
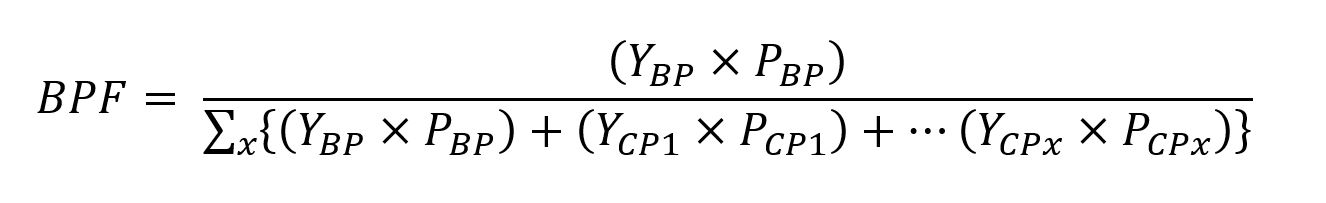
In Equations 3b and 3c P is the price of the marine ingredient, by-product or other co-products (BP, CP). Therefore, the PF is the proportion of the value of any particular marine ingredient of the total value and the BPF is the proportion of the value of that by-product of the total co-product value from fish processing. FIFO and eFIFO are the sum of all the marine ingredients from different species or by-products 1 to x multiplied by the FCR.
Equation 1 shows the fishmeal dependency ratio but the same equation can also be used for fish oil dependency using the appropriate yields and inclusions. Hence a FFDRfm and FFDRfo can be calculated separately and the one with the higher number relates to the limiting ingredient. This metric is useful for certifiers to set limits on forage fish dependency/ utilisation for certain species, but it does not take into account the “spare” marine ingredients (i.e. the discrepancy between unequal FFDRfm and FFDRfo) for any particular species. The FIFO approach by Jackson (2009) is more of an industry-oriented approach that reflects global flows of marine ingredients and considers the discrepancy between yield and inclusion. Both methods in Equations 1 and 2 do not include the fish inputs from by-product resources. When the methods were first employed, the focus of NGOs and industry was to shift the dependency away from forage fish and to encourage the utilisation of poorly utilised and wasted by-products from seafood processing. Essentially, those by-products were given a “free pass”. However, it is now the case that around a third of fishmeal and fish oil supplies come from by-product resources and they are becoming important in the motivation for fishing and more efficient processing. The eFIFO method in Equation 3 essentially uses the same methodology as the Jackson method (Equation 2) but determines rendering yields by economic proportions rather than by mass proportions, using a principle of “embodied fish” (Kok et al., 2020) using a “by-product factor” i.e. the by-product factor is a multiplier equal to the percentage by-product value of the total processed fish value (i.e. all the co-products). Limiting ingredients are usually proportionately more expensive (e.g. fish oil is often more expensive than fishmeal) which means that formulations that contain more of the limiting ingredients would have a higher eFIFO. The methodology also applies to by-product utilisation. As by-products are often low value and poorly utilised, their proportionate value at the fish processing stage is low and therefore they have a low “embodied fish” that is carried through into the eFIFO calculation e.g a tonne of herring fish by-product has an embodied fish value of 188kg (and a by-product factor of 18.8%), the reasoning for this will be more fully explained during the LCA section on “allocation”. Table 4 shows an example of FIFO calculations using the different methodologies for fish produced on a hypothetical diet containing different amounts of anchovy and herring by-product marine ingredients with a total inclusion of 20% and a FCR of 1.2.
Table 4. FIFOs using different methodologies for four
hypothetical diets containing marine ingredients from anchovy and herring
by-product raw materials. FCR = 1.2, anchovy yield; meal (AM) = 22.5%, oil
(AO) = 5%, herring by-product yields; meal (HBM)= 22.5%, oil (HBO) = 17%.
Herring by-product “embodied fish” = 18.8%*
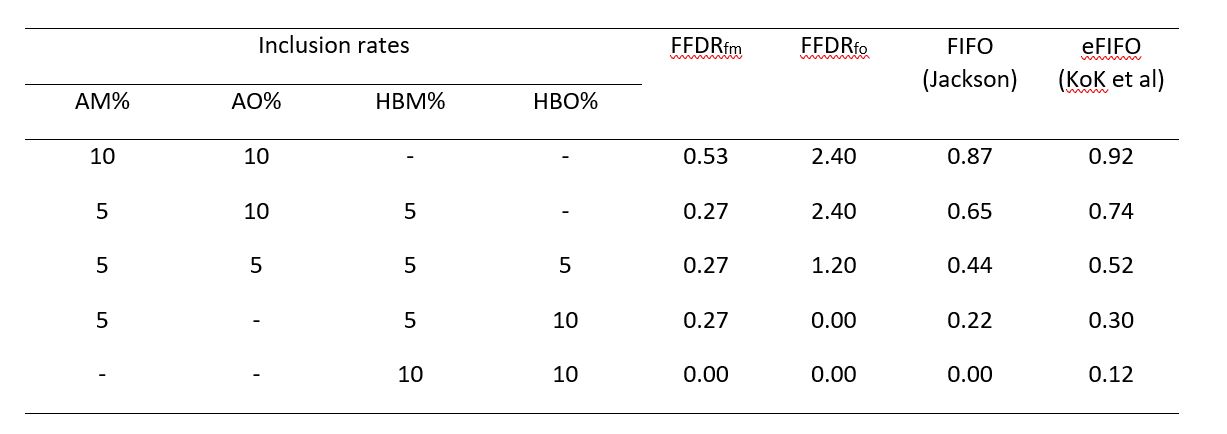
* The values for fishmeal and oil are taken from OECD/FAO (2018), the yields for anchovy meal and oil from Freon 2017 and for herring by-product meal and oil from (Hilmarsdottir et al., 2020).
There are clear differences between the methods. The FFDR shows that the limiting ingredient is fish oil because the proportionate inclusion of oil compared to yield is much greater than meal from forage fish. Therefore, it takes 2.4 tonnes of anchovy to produce the necessary oil but only 0.53 tonnes of anchovy to produce the meal required. As the anchovy is replaced by by-products, the FFDR is reduced because by-product resources are not counted. The Jackson method provides what could be considered a weighted average between the FFDR for meal and oil but does not take into account the limiting ingredient or the inclusion of by-products. The eFIFO method weights the inclusions according to their various values, which are assumed to be a proxy for the more limiting ingredients, whether that is the differential between meal and oil from a particular raw material, or between the utilisation of by-products compared to products for human consumption. Therefore, eFIFO is the only one that represents by-product inclusion but does not penalise their use if they were previously underutilised. In Table 1, the by-product value was set at a default of 10% of the main product per unit volume (around 9% overall given a fillet yield of 52%), but if by-products became better utilised and of higher value proportionately, then they would become more limiting and the eFIFO would also increase (see (Kok et al., 2020) for a full discussion).
Biotic Resource Use (BRU) is similar to FIFO in that it has primarily been used as a measure of marine resources in feed (e.g. Pelletier et al. 2009). It measures the accumulation of carbon appropriation through ecosystems that are exploited within a supply chain. For example, it measures the carbon content of fish species used within marine ingredients as a function of their trophic level according to the equation by Pauly and Christensen (1995).
Equation 4 Biotic resource use calculation according to Pauly and Christensen (1995)
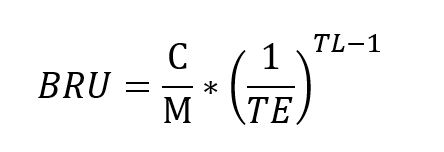
Where C is the mass of the catch, M is the ratio of biomass to carbon content, TE is the transfer efficiency and TL is the trophic level of the species. According to Pauly and Christensen (1995), M is typically given as 9 and the TE is 10.
BRU differentiates between higher trophic species where FIFO does not. However, that does not reflect the status of the stock, whether it is well managed or not. There are many possible interactions that can occur by fishing various trophic levels (Pauly et al., 1998) and trophic level is no indicator of sustainability as can be seen in Chinese feed fisheries (Zhang et al., 2019). However, BRU does largely track FIFO because BRU for vegetable ingredients is negligible in comparison and only relates to carbon appropriation through land-use change. FIFO is often regarded as a more tangible metric that is easy to understand by consumers and policymakers. A FIFO below 1.0 is easy to understand as reflecting a net production of fish whereas BRU can run into tens of thousands of kg of carbon appropriation per tonne of aquaculture production. BRU is linked to a logarithmic scale so there is large variation and the threshold of what is considered good or bad is not completely clear but could be more applicable when trying to assess trade-offs between marine and terrestrial ingredients.