Socio-economic indicators
In the following video, Professor David Little discusses some of the ways in which social and socio-economic factors for sustainable aquaculture can be measured through the use of indicators.
As aquaculture continues towards becoming a key and integrated part of broader food systems there is an increasing necessity for progress toward sustainability to be assessed in line with the UN Sustainable Development GOALS (SDGs).
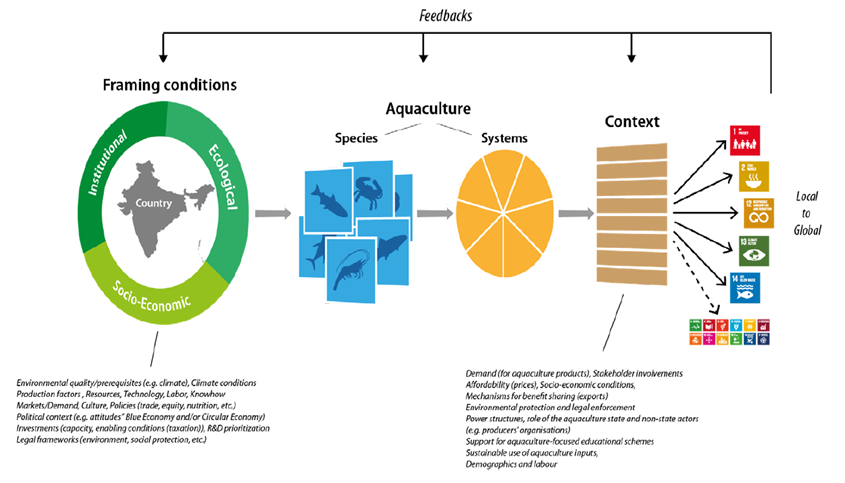
Figure 3. Conceptual figure illustrating what is "shaping" aquaculture's contribution to the SDGs ("rule of the game") and also the feedback enabling adjustments for reaching desired targets/outcomes
In the Figure above the critical role of context in terms of assessing SDGs at a local and global nature is clear. This framing also identifies the need to develop indicators to measure progress towards the multiple SDGs that acknowledge such factors. Osmundsen et al. (2020) developed a “Wheel of Sustainability” to improve understanding of factors affecting sustainability through aquaculture certification schemes and this approach has been used on a case study basis to assess alignment with the SDGs. Three of the four quadrants (Social, Economic and Institutional) are centrally driven by expectations of improving societal level sustainability.
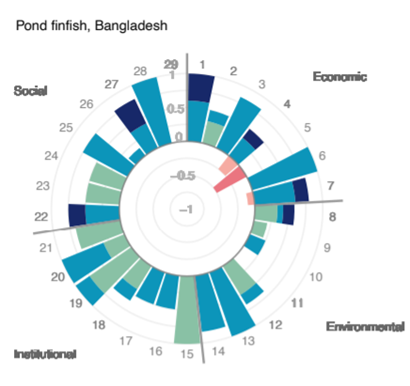
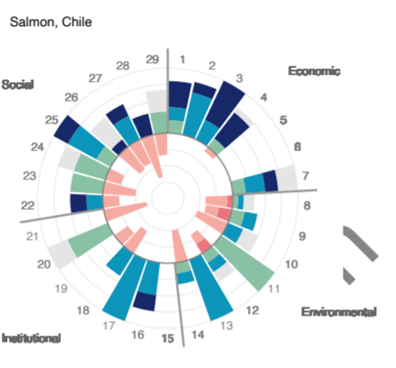
Figure 4. Example "wheels of sustainability" for two aquaculture species/systems (Source: Troell et al, 2021)
Improved governance of aquaculture has been identified as a critical platform for sustainability improvements and these now extend beyond private label, farm-level certification and country-level involuntary assessments to approaches more inclusive
of producer level realities. An initiative to address governance in aquaculture has been launched at https://www.aquaculturegovernance.org/. Further information in the video below:
Governance, a range of social processes and practices underpins “the solving of societal problems and creating societal opportunities through interactions among civil, public and private actors” and the 26 Aquaculture Governance Indicators
support the analysis of the routes that regulatory systems, voluntary codes and standards, and other activities can support identification of environmental issues and responses to problem-solving. Making explicit pathways for governments, industry
and civil society actors to collaborate around sustainability challenges is a key ambition of this integrated framework. See also Kooiman (2008).
Approaches to assess the social and economic impacts of aquaculture are dependent on scale and context. Levels of production and consumption of aquatic animals can be useful to provide a macro view of economic and dietary importance. Although fisheries can assume prominence in the small economies of Pacific Island States for example attaining around 10% GDP, for aquaculture alone it rarely exceeds 2% in countries such as Bangladesh and Vietnam where aquaculture has grown to supply more than 50% of total seafood supply over the last decades
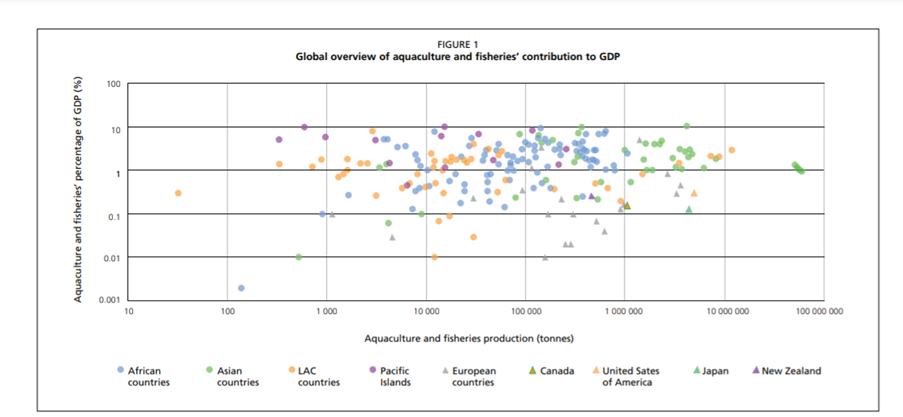
Figure 5. Contribution of aquaculture and fisheries to national gross domestic product (source: Cai et. al. 2019)
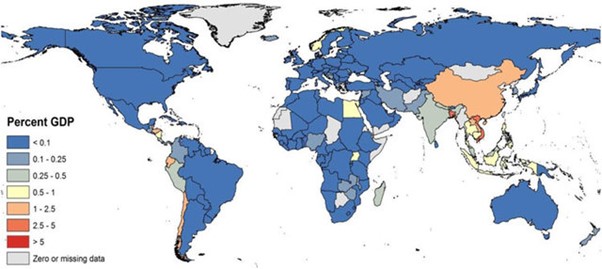
Figure 6. The contribution of aquaculture to GDP (source: Little et. al., 2016)
Indeed some studies have concluded that aquaculture has little impact on nutritional security (Golden et. al. 2017) claiming aquaculture tends to serve the better off internal markets
and export demand. Although the global nature and value of aquaculture have often been emphasized, most trade is domestic or regional (Bush et. al., 2019).
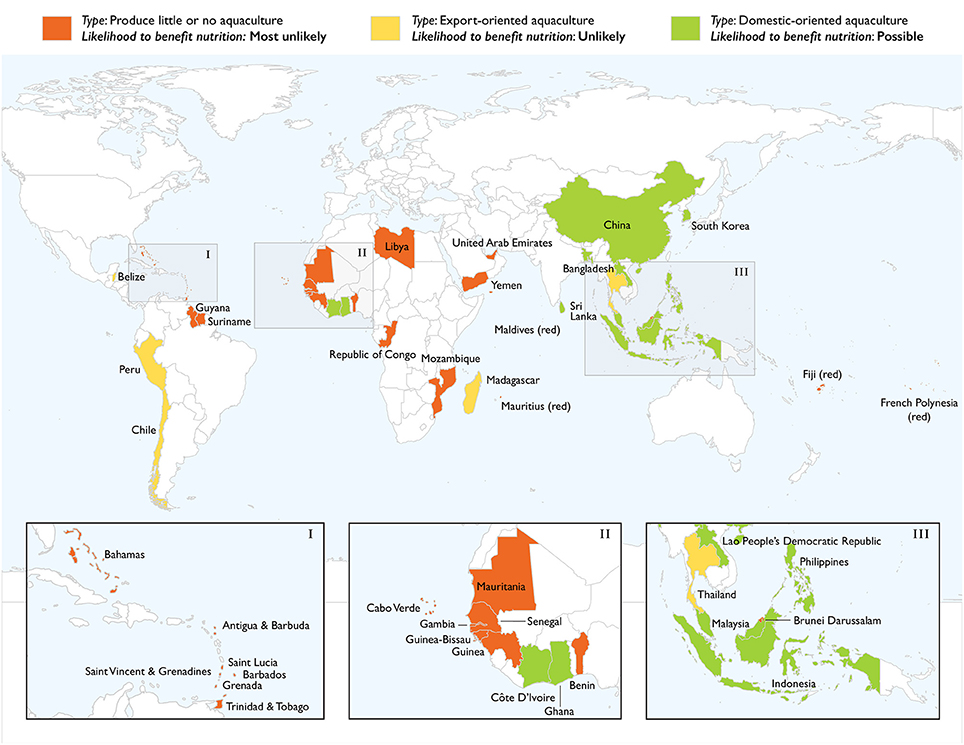
Figure 7. Characterisation of countries according to the orientation of aquaculture industry towards domestic or export markets (Source: Golden et. al. 2017)
Moreover, analysis based on FAO data suggests the importance of aquaculture to low and medium-income people in domestic markets where it is most developed.
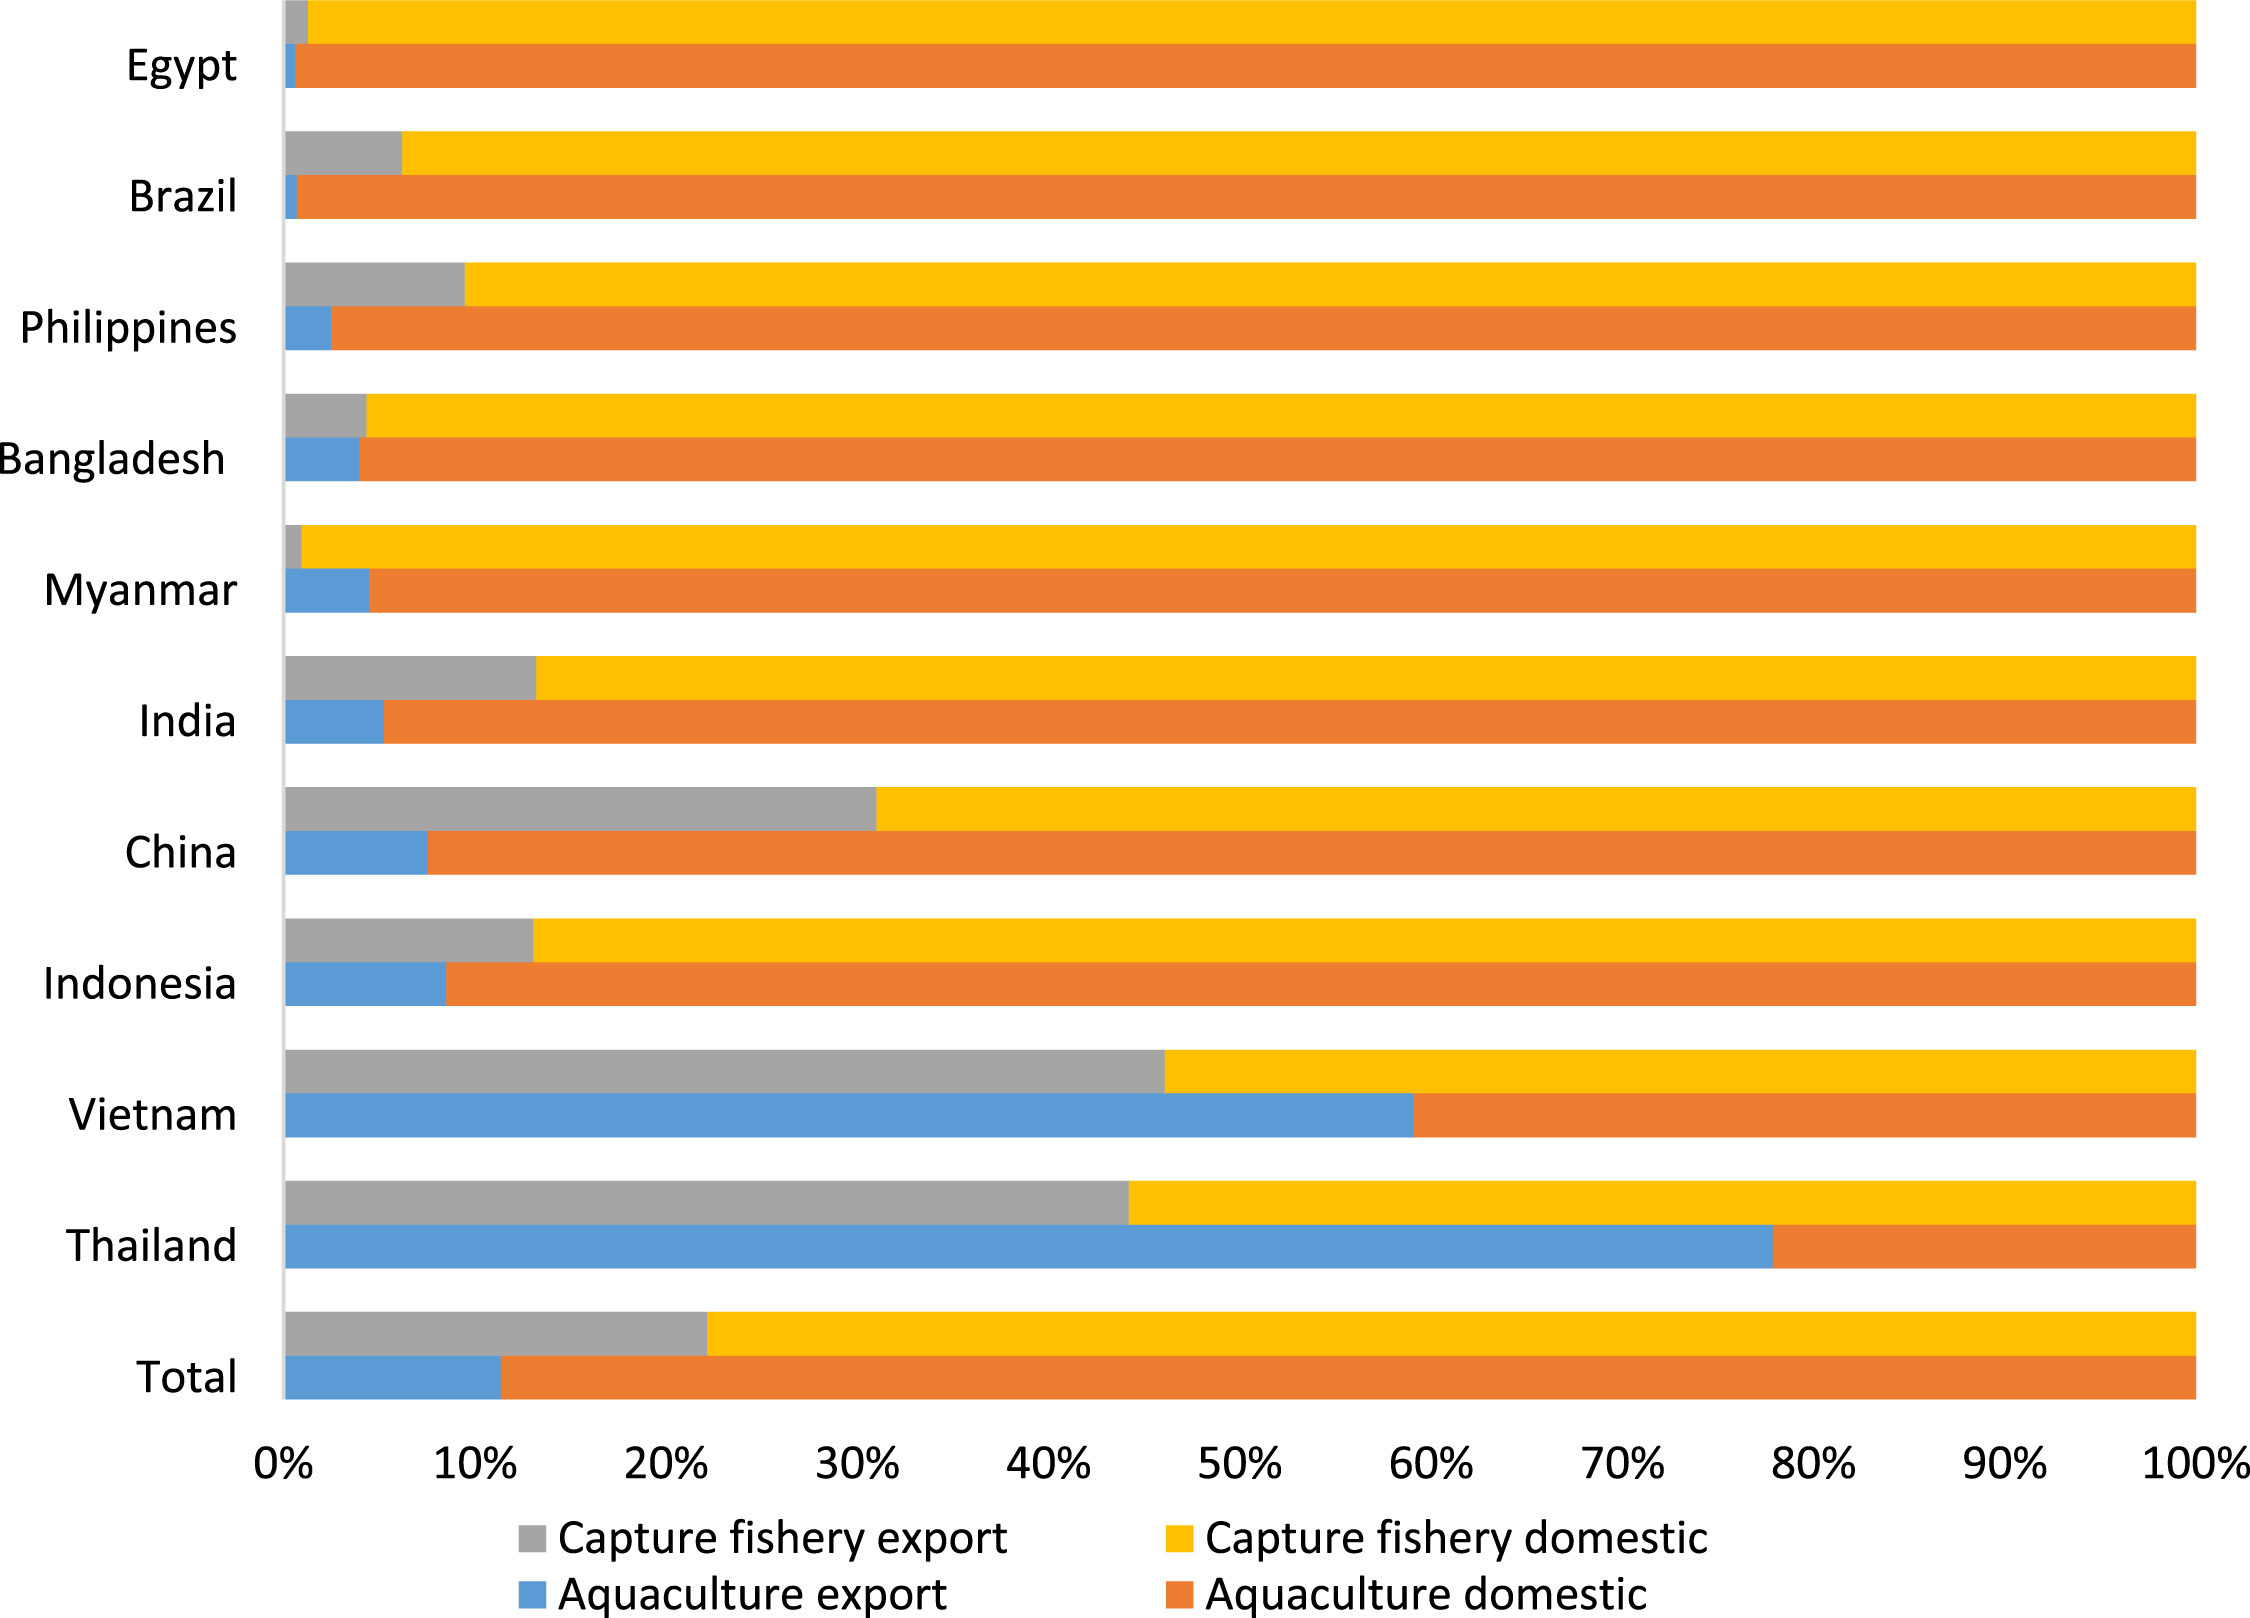
Figure 8. Aquaculture and capture fisheries exports and apparent domestic consumption in selected countries (2011) (source: Belton et. al. 2018, using data from FAO
FishStatJ database)
Consumption benefits
Global analyses of consumption estimates are problematic with most being based on ‘apparent consumption' (i.e. on the amount of fish being produced and traded) rather than observation, self-measurement or even household-based recall. In many contexts, market purchase of aquatic animals may dominate and make data collection possible but in contexts where self-provisioning is still important, such data may essentially be invisible. The dietary benefit is also complicated by estimates of the actual edible portion, which is in turn impacted by culture, preparation norms etc. Significant variation between the fillet portion by species and the direct likelihood of use of coproducts (heads, frames, skin) all contribute to making most current estimates being unreliable. Mass balance estimates (such as that produced by GAIN for the key European species, may be useful to inform policy strategy.
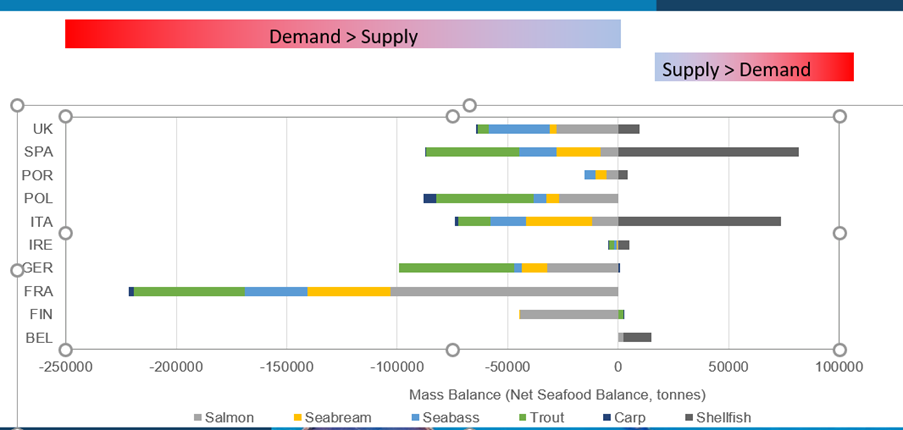
Figure 9. Mass-balance calculations for seafood supply and demand for selected European countries (source: GAIN Project Data)
Inclusive business models
A value chain approach is required to understand how benefits are distributed through the sector as aquaculture expands. Perhaps two-thirds of total livelihood benefits accrue to small-scale actors overall currently (Short et. al., 2021) but there is a challenge to maintaining and strengthening the inclusion of small scale actors in aquaculture value chains as they become more industrialised, require higher capital investment and target consolidated
markets (Kaminski et. al., 2020). In general, there is a multiplier of employment of around 1-4 between production and other parts of the value chain but these figures can vary widely.
Age, education and gender interact to strongly impact the nature of employment benefits. The type of aquaculture system that affects employment opportunities is full-time or part-time, seasonal or year-round. Contracted labour and services are common
for specialised activities which may open up opportunities even in consolidated sectors such as farmed Atlantic salmon. In some industries, there is a high reliance on expatriate labour which may be at the lower or higher skill level.
Commercial intensive aquaculture in many Sub-Saharan African countries relies on management whereas Norwegian salmon and Thai shrimp sectors are highly dependent on migrant labour. Wages are often comparatively higher in the aquaculture sector than
alternative employment in the same location although a dualistic situation where managers get more and labourers less is also a feature of some industries (Hishamunda et. al., 2014).
Social and labour standards aiming to safeguard terms of employment and occupational health and enhance positive social impacts have increasingly become an area for business-level certification, whether on-farm or in the supply chain. But concerns about broader social and economic impacts at the community level and the various global value chain nodes have also become critical following abuses around forced and slave labour. The areas covered by one international certification scheme (GSA/BAP) indicates the range of the issue and the relatively high level of compliance to standards attained by certified facilities through the supply chain.
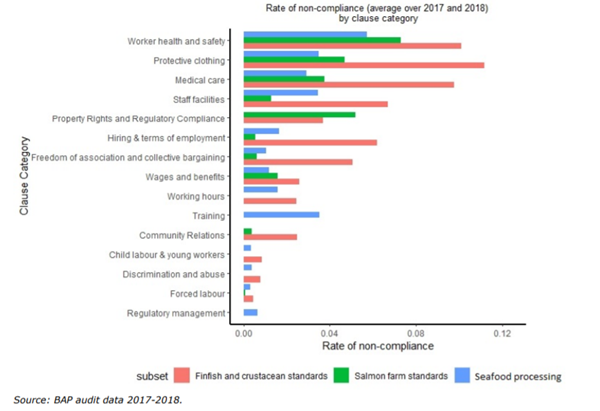
Figure 10. Rate of BAP non-compliance for finfish and crustacean farm, salmon farm and processing plant standards in 2017 and 2018 (mean) at audit (source: Kruijssen et. al. 2021)