Impact Assessment Phase
The Impact Assessment phase is the main modelling phase where LCI emissions are compiled and characterised into impact categories. The method of impact assessment dictates exactly how this is performed and although there are broad similarities, there are differences concerning the inclusion of different impact categories and differences in how they are calculated. The assessment method will be decided during the Goal and Scope phase.
The first decision to be made
following the choice of assessment method is which impact categories to include.
Although this is largely dictated by the choice of impact assessment method and
built into LCA software (baseline categories), the practitioner can choose to
omit some categories or include others (study-specific). These may need to be
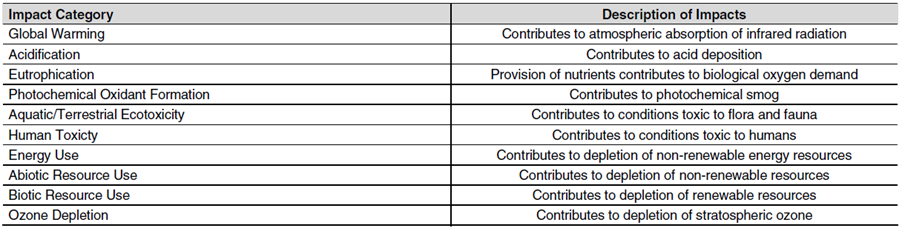
defined by the user. Some typical impact categories are shown in Table 1.
Table
1. Impact categories for seafood production
(Pelletier et al 2007)
Many
of the key databases are held on specialist LCA software that calculates the
footprint of products using inputs from those databases and the primary data
inputs collected from fieldwork. LCA software packages include; Simapro, GaBi,
OpenLCA, Ecochain amongst others, with different levels of functionality, with
some like SimaPro aimed at academic studies or Ecochain designed more for the
corporate user. The complete LCI data are made up of the primary secondary and
background data which altogether are usually so complex in terms of the
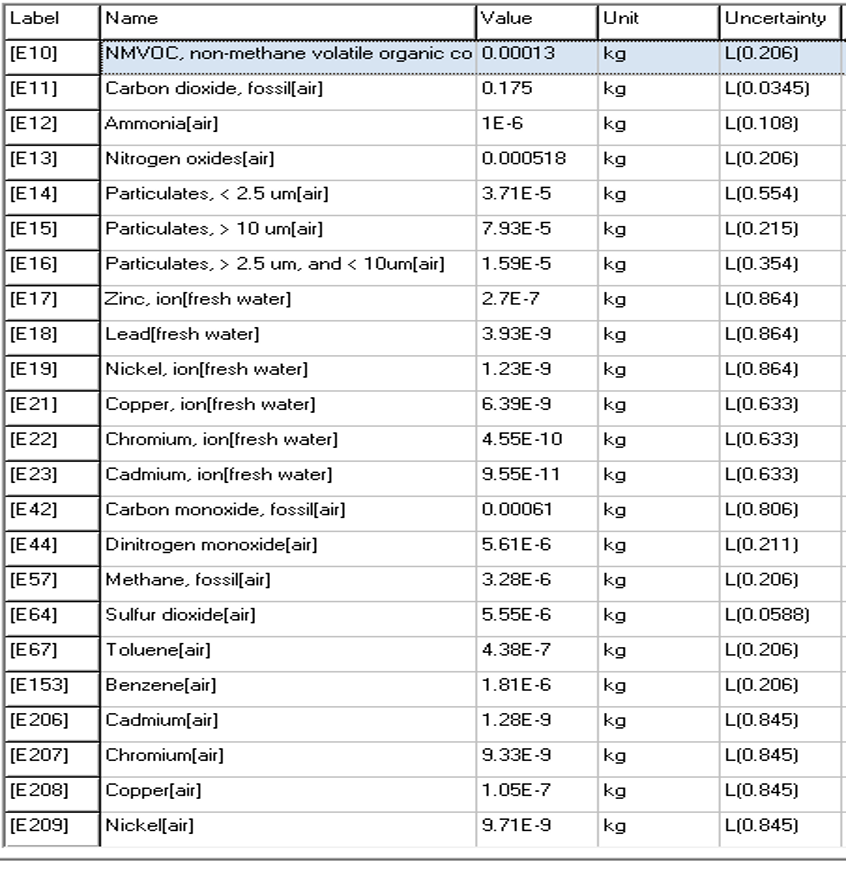
number of emissions that comparing
them between different products or systems in any meaningful way is virtually
impossible (Table 2). Therefore, the data have to be converted to allow for
interpretation of trade-offs between different impacts and comparison between
different products. To make LCIs for different products comparable, the
software calculates the cumulative emissions along the supply chain
according to the “reference flows” of the system and then converts the
emissions to impacts using “characterisation factors”. For example, there are
many GHGs that have varying effects upon global warming (e.g. Table 2). The
software converts the emissions in each category to a single emission
equivalent, in the case of Global Warming Potential (GWP), which is carbon
dioxide equivalents. 1kg of methane emissions is calculated according to its
“characterisation factor” as having the same GWP as 28kg of carbon dioxide over
100 years according to characterisation models provided by the
Intergovernmental Panel on Climate Change (IPCC (2013)).
Other emissions are characterised by other impact categories in the same way
according to characterisation factors for each emission and impact category. In
some cases, a single emission may contribute to more than one impact category,
but the assessment is made on the potential to cause impact, rather than actual impact, i.e. the
actual global temperature rise is not calculated. Other impact categories such
as Acidification Potential or Eutrophication Potential can then be
characterised in the same way.
Table 2. An example of typical LCI emissions before characterisation, generated by Simapro software
Some of the most common characterisation factors
for impact categories are given in Table 3, although different assessment
methods use different factors. Each of the emissions, such as those found in
Table 2 are then characterised according to the various different
characterisation factors into the different impact categories. Note that in
Table 3, ammonia contributes to both Acidification and Eutrophication
Potentials. No effort is made to assess how much of the ammonia contributes to
each one but is considered to contribute 100% to both. This is not considered
double counting, because the “potential” impact is being measured. This is
considered a “mid-point” assessment, compared to an “end-point” assessment that
might measure the total damage from acid rain or the amount of primary
productivity from eutrophied water bodies, for example.
The purpose of characterisation to impact categories is to provide more manageable outcomes which can be used for policymaking. However, this can sometimes lose the necessary detail over various local and global trade-offs. Weighting is another optional step in LCA where certain categories are given precedence. Indicators can also be aggregated into an index along with other quantitative and qualitative indicators to provide a more holistic assessment. Although weighting often includes value loaded choices, the objective of the weighting procedure is not to create value judgements but to make assessments equitable between products or systems. The process can be aided by continual stakeholder engagement throughout the process.
Table 3. Example of
characterisation factors for some of the most commonly used LCA impact
categories.

The number of ticks is an indication of how common the category is.
*Blue water is abstracted from water sources such as rivers or groundwater.