

2.1 Calculating the unit cost
Continuing with the example from Section 2, the changing unit cost of production is shown in Figure 6.

To calculate the unit cost, divide the total of fixed costs and variable costs by the number of units produced. An example is given in Activity 3.
Activity 3 Calculation of the unit cost
Using the following information for a period, calculate the unit cost at production levels of 2,000, 4,000 and 5,000 units of output. You can use this spreadsheet [Tip: hold Ctrl and click a link to open it in a new tab. (Hide tip)] to complete this activity.
| Fixed costs | £264,000 |
| Variable costs per unit | £279 |
Comment
| Production levels | 2,000 units | 4,000 units | 5,000 units |
| £ | £ | £ | |
| Variable cost per unit | 279 | 279 | 279 |
| Total variable costs | 558,000 | 1,116,000 | 1,395,000 |
| Fixed costs | 264,000 | 264,000 | 264,000 |
| Total costs | 822,000 | 1,380,000 | 1,659,000 |
| Divide total costs by no. units | 2,000 units | 4,000 units | 5,000 units |
| Unit cost | = £411 | = £345 | = £331.80 |
It is important to bear in mind that both fixed and variable costs may only behave in this way over a relevant range. For example, within the relevant range (see Figure 7), unit variable costs are assumed to be constant. Beyond this range, they are not. (This could be due to bulk discounts in purchasing materials, for example.) In Figure 7, variable costs (per unit) are only constant between 600 and 1,200 units.
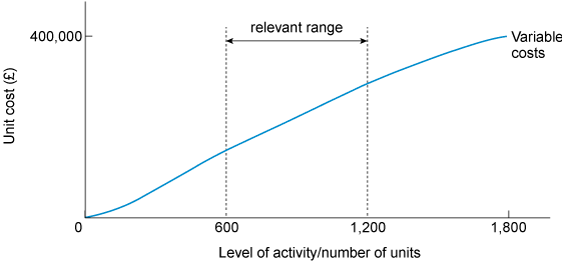
The relevant range in Figure 7 refers to a specific activity level that is bounded by a minimum and maximum amount. Within the designated boundaries, certain cost levels can be expected to occur. Outside that relevant range, costs will likely differ from the expected amount.