

2 Cost behaviour
An understanding of how costs vary with different levels of activity is essential for decision making. Figure 3 shows the pattern of costs in relation to the volume of activity, based on the information shown in Table 3 for a period. The level of activity can be expressed in terms of the units of production or the level of service activity.

The table below shows the variable costs at the maximum output and the fixed costs of the company.
| Variable costs per unit | £80 |
| Maximum output in the period | 3,000 units |
| Variable costs (at maximum output) | £240,000 |
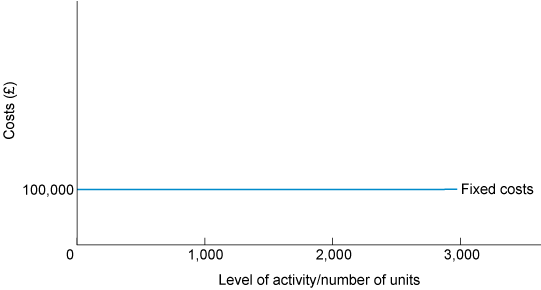
| Fixed costs | £100,000 |
We can calculate variable cost (VC) per unit as follows:
Maximum output in period = 3,000 units
VC at maximum output = £240,000
VC per unit = £240,000/3,000 = £80 (assuming fixed costs remain constant at £100,000)
The relevant range for which these relationships hold is 0–3,000 units.
Note how the variable costs are proportional to the level of activity and how they are always zero when the level of activity is zero.
Note also how the fixed costs remain constant at all levels of activity within the relevant range (Figure 4).
The two graphs can be combined to show total costs (Figure 5).

At a production level of 3,000 units, the total cost is £340,000, resulting in a unit cost of £113.33. If the production level was 1,800 units, the total cost would be £244,000 (fixed costs of £100,000 plus variable costs of £144,000) and the resulting unit cost would be £135.56. As the volume of activity declines, the unit cost increases. Conversely, as the volume of activity increases, the unit cost decreases.
Activity 2 Cost changes
Look again at the figures above and explain why the unit cost changes.
Feedback
The reason is that, with reducing volumes, each unit has to bear proportionately more of the fixed costs and, with increasing output, proportionately less of the fixed costs.