2.1.1 Averages – mean and median
This section covers two different types of averages – the mean and the median.
An average value is often used to provide a ‘typical’ value for a set of data. There are several ways of expressing a typical value, but the most common are the mean and the median.
In this study note you will look at two different types of averages – the mean and the median.
Mean values
The mean value (commonly called the ‘average’, although it is just one type of average) is obtained by adding up all the values of a set of data and dividing by the number of items in the set. For example, if three individuals have carbon footprints of 13, 9 and 17 tonnes CO2e per year, their total footprint is 13 + 9 + 17 = 39 tonnes CO2e per year. Their mean footprint is the total divided by the number of individuals, i.e. 39/3 = 13 tonnes CO2e per person per year.
To calculate the mean carbon footprint of a UK inhabitant (in 2019) using the information in Figure 4, divide the total UK emissions of 774 million tonnes CO2e by the 2019 UK population of 66.4 million. The result is 11.67 tonnes CO2e per person per year rounded to one decimal place. (See Rounding numbers, decimal places and significant figures later in this section.)
Median values
Although the example above gave a value for the amount of CO2e emissions that could be attributed to each person on an equal basis, this may not represent a ‘typical’ person. This is because there may be a group of heavy emitters that have a larger effect on the total (and hence the mean) than the majority of more modest emitters. In this case the median is a better indication of a typical individual’s footprint.
So, if the carbon footprints of a sample of 11 individuals were 21, 6, 15, 16, 10, 9, 13, 25, 12, 11, 27 tonnes CO2e per year, the mean footprint is 165 tonnes CO2e per year / 11 = 15 tonnes CO2e per year.
The median footprint is obtained by arranging the data into numerical order, as follows:
6, 9, 10, 11, 12, 13, 15, 16, 21, 25, 27 tonnes CO2e per year the median footprint is the middle value in the set = 13 tonnes CO2e per year, i.e. the sixth value in the set, with five below and five above it.
If there are an even number in the sample, say 10 individuals with footprints of
9, 10, 11, 12, 13, 15, 16, 21, 25, 27 tonnes CO2e per year
then the median is halfway between the two middle numbers (13 and 15), i.e. 14 tonnes CO2e per year, again with five values below and five above.
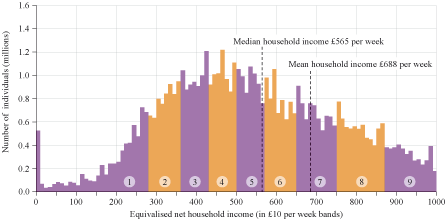
Consider another example, the UK’s income distribution. Some people have very high incomes and some have low incomes, with the majority spread between the extremes. Figure 6 shows the official distribution of the UK population by household incomes (after tax and before deduction of mortgages and rents) in 2021–22. The mean household income in 2021–22 is £688 per week , calculated by adding up all the incomes and dividing by the number of individuals living in households whose incomes were measured.
The median income is the amount which divides the income distribution into two equal groups, half having an income above that amount, and half having an income below that amount. The median household income in 2014–15 is £473 per week (£24 596 per year), which is less than the mean and more representative of an ‘average’ or ‘typical’ household.