

1.3 Measuring carbon footprints
There are different ways of measuring the carbon footprints. The territorial perspective measures the CO2e emissions produced within a country’s borders, excluding emissions from international aviation and shipping. From this perspective, the power stations, factories, farms, etc. within each country are mainly responsible for that country’s emissions, while households are directly responsible for only a relatively small percentage (about a fifth) of the total.
For the UK, the production perspective measures CO2e emissions produced by UK residents and industry whether in the UK or abroad, excluding emissions within the UK by overseas residents and businesses. International aviation and shipping emissions are allocated to countries based on the operator of the vessel.
As the focus of this course is on the carbon footprint of individuals and households, and that’s what the carbon calculator, which you’ll be using later, measures, we will be looking at the consumption perspective. While individuals and households may be ultimately responsible for triggering most GHG emissions, they don’t directly control how much of those emissions are produced and so can’t be expected to reduce them unaided. There will be more about this later.
The consumption perspective, on the other hand, refers to CO2e emissions that are associated with the consumption spending of a country’s residents on goods and services wherever in the world these emissions arise, and so includes emissions arising from the production and distribution of imports. The focus of this course is on the carbon footprint of individuals and households, so that’s what the carbon calculator you’ll use later measures, utilising the consumption perspective. It is important to remember that while individuals and households may be ultimately responsible for triggering most GHG emissions, they don’t directly control how much of those emissions are produced and so can’t be expected to reduce them unaided. There will be more about this later.
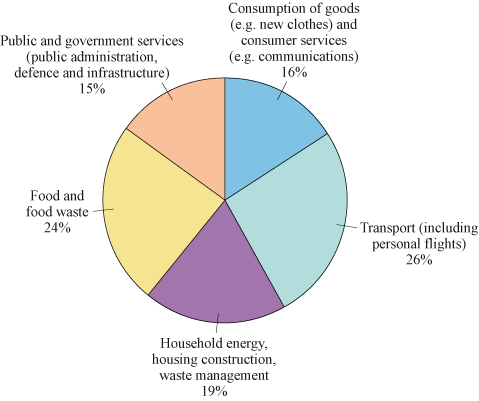
Figure 3 is a pie chart that shows the percentage breakdown of an average UK resident’s carbon footprint when it was calculated using the 2019 national carbon footprint data. Although this footprint has reduced since 2019, mainly due to the reduction in emissions from electricity generation, its main components remain broadly the same.
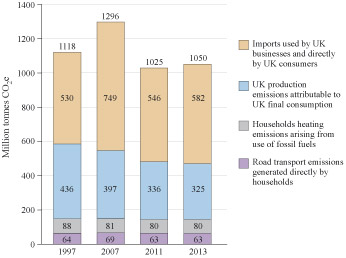
The UK government measures consumption emissions, which are based on the country’s production emissions plus the emissions associated with imports, minus the emissions associated with exports. The result is the UK’s carbon footprint, which has been calculated by the University of Leeds and published by the Department of Environment, Food and Rural Affairs (DEFRA). Figure 4 is a stacked bar chart that shows the UK’s declining consumption carbon footprint for selected years from 2000 to 2019. In a stacked bar chart the components that make up the total are ‘stacked’ in each bar.
The carbon footprint updated to 2020 showed a reduction from 2019 (DEFRA, 2023). However, the 2020 footprint coincided with the COVID-19 pandemic when much of the economy was shut down. The official 2019 UK footprint has therefore been used as latest available representative result at the time of writing.
Notice that in Figure 4 the direct carbon footprint of households (the bottom two sections of each bar) from home heating and car driving is relatively small. This is because this breakdown uses the footprint boundaries mentioned earlier, in which household electricity for lighting and appliances, travel by public transport and holiday flights are considered as indirect sources of emissions. The total indirect carbon footprint (the top two sections) includes these emissions plus the emissions arising from the consumption of food, goods and services both produced in the UK and associated with imports.
This and other studies have shown that nearly half the UK carbon footprint is the result of the GHG emissions associated with imports, notably electronic products, clothing and motor vehicles from the EU and Asia. This means that the emissions from an individual’s consumption of imported goods and services are generally a major part of their carbon footprint.
Also included in the total carbon footprint in Figure 4 are emissions from government activities, including public administration, health, education, defence and capital investment, for example, in railways. This residue, which arguably can’t be allocated directly to households, amounts to 30% of the total UK carbon footprint (DEFRA, 2023).
This means that consumption decisions by individuals and households are responsible for creating or triggering about 70% of the UK’s carbon footprint. This proportion is typical for a Global North, country, such as the UK, Germany or USA, where consumption of energy, food, and other goods and services by individuals and households accounts for 60% to 70% of economic output (Ivanova et al., 2016).
Now complete Activity 1 to test your understanding of carbon footprints.
Activity 1 Carbon footprints
- a.What is a carbon footprint?
Answer
A carbon footprint is the total annual mass of ‘carbon’ emissions which result directly or indirectly from the activities of an individual or a group of people, from an event, or from providing a product or service.
- b.Refer back to the pie chart in Figure 3. What does the chart show are the main components of an average UK resident’s carbon footprint?
Answer
Figure 3 shows that the three main components of an average UK resident’s carbon footprint, accounting for about 70% of the total, are:
- • transport (by car, public transport and air)
- domestic energy use, housing construction and household waste
- •food consumption and food waste.
The remainder of the average footprint (about 30%) is roughly equally generated by (i) consumption of goods (such as new clothes) and private (or consumer) services (such as banking and communications),and (ii) use of public and government services.