

2.3.3 Differences between people and places
Mean individual and household carbon footprints for a country conceal the differences within that country. As you saw for the UK, these differences in carbon footprints are strongly related to income and can be very great.
For example, the values given in Table 1 for 2022 hide:
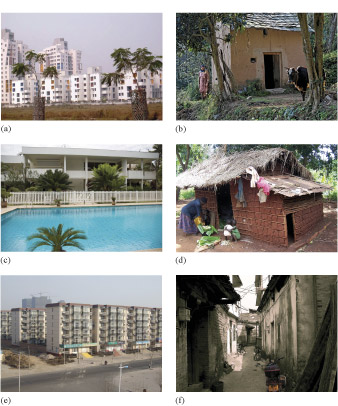
- in India, the 2015 mean carbon footprint of 1.7 tonnes CO2 per person per year hides the differences between middle-class Indian households living in air-conditioned apartments and owning a television, refrigerator and motor scooter, or perhaps a car (Figure 10(a)), and the household of a subsistence farmer, whose only fuel is dried cow dung for cooking, and perhaps kerosene for a lamp (Figure 10(b))
- in Africa, the contrast between the elite, who may have a private swimming pool, and villagers who have to collect water for cooking and washing (Figures 10(c) and (d)) is not shown
- in China, where the lifestyles of the wealthier members of the very rapidly growing urban population still contrast with those of people living in China’s villages and rural areas (Figures 10(e) and (f)).
Now watch the following videos. The first video by the late statistician Professor Hans Rosling graphically demonstrates that the richest billion people in the world emit most of its total carbon dioxide emissions, while the poorest only emit a small proportion. Although this video was made in 2013 and the data have evolved, the basic message still holds. The second video expands on why it is important to compare carbon dioxide emissions per person for different countries (as in Table 1 and Figure 8), rather than just total emissions, in order to develop policies for tackling climate change on a fair basis.
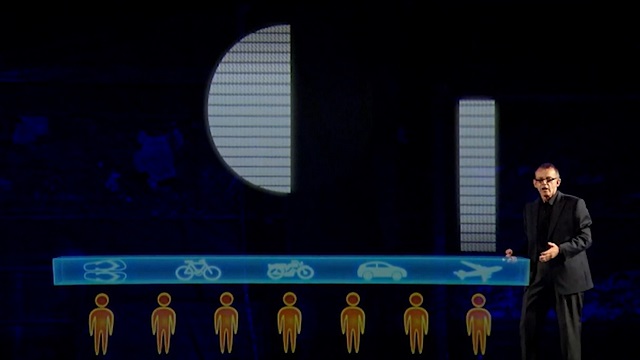
Transcript: Video 1 Who is responsible for carbon emissions and climate change?
Transcript: Video 2 Carbon emissions per country and per capita
Activity 4 Income and carbon emissions across the world
- a.Why is it important for international agreements on reducing carbon dioxide (and other GHG) emissions to compare countries on their emissions per person as well as on their total emissions?
Answer
When attempting to negotiate international emissions reduction agreements, comparing mean emissions per person of different countries is fairer and so is more likely to be acceptable to Global South countries wishing to industrialise.
- b.Which groups of countries are historically responsible for the main growth in carbon dioxide emissions, and from which groups will the main growth come in the future?
Answer
The historical growth in emissions has been from the developed countries during their industrialisation since 1800; some are now stabilising or reducing (though not fast enough). The future growth in emissions is likely to be from newly industrialising countries (e.g. India) and developing countries (e.g. Thailand) whose residents earn between $10 and $100 per day on average.
- c.What do the videos suggest that different countries should aim for to reduce their emissions?
Answer
Developed countries with very high carbon emissions per person, like the USA, should reduce their emissions to the lower level of other developed countries like France and Sweden. Rapidly developing Global South countries like India and Thailand should try to avoid the path of the Global North by preventing their emissions per person from growing as much.
- d.What do the videos leave out of his analysis?
Answer
The analysis in the two videos does not include non-CO2 GHG emissions or the emissions associated with imports and exports, but the basic lessons still apply.