2.1.2 The effect of incomes and household types
The carbon footprints given in Section 2.1 are averages (means) for a UK inhabitant. But, as mentioned earlier, footprints differ considerably for different individuals and households.
A factor which generally has a major effect on the footprint is individual or household income (a distribution of which was shown in Figure 6). In general, the higher a person’s or household’s income is, the higher their carbon footprint will be. This is not just because wealthier people generally consume and travel more, but because, even if they spend little and save a lot, unless they deliberately invest in ‘green’ carbon saving funds or projects, their money will be invested to make products and in services for consumption, which indirectly adds to their footprint.
An early UK study of income and carbon footprints analysed how the footprint per person differed for ten groups, from households with the lowest 10% to households with the highest 10% of incomes (Gough et al., 2012). The study showed that the carbon footprint per person for households with the highest 10% of incomes was about three times that of people living in households with the lowest 10%.
The carbon footprint per person also varied with household size. One-person households generally had heavier footprints per person than those with two or more occupants. This is because people living alone usually occupy and heat a bigger space per person and don’t share as many goods and services as larger households. So, one of the barriers to reducing carbon footprints is the number of one-person households (nearly a third of all UK households in 2022). Sharing your home, therefore, can be one of the most effective ways of reducing your personal footprint.
A more recent UK study analysed the total energy footprint per person for ten income groups. Similar to the findings of the 2012 carbon footprint study, it showed that the wealthiest 10% used three times as much energy in total as the poorest 10%. The differences were greatest in energy use for transport and recreational activities. The wealthiest 10% used around three times as much energy driving cars and five times as much for recreational activities, including package holidays, when compared to the bottom 10%. Flights taken by people with the highest incomes used around five times more energy than those taken by the poorest, while spending on furniture and clothes by the wealthiest used about four times the energy of such spending by the poorest (Baltruszewicz et al., 2023). Although this study measured energy footprints, these are strongly related to carbon footprints.
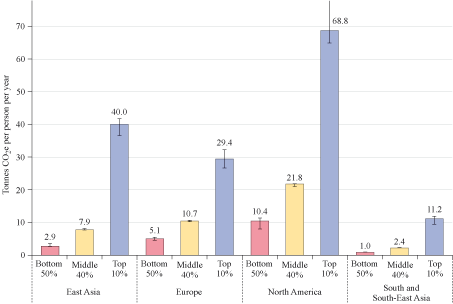
Other recent studies have shown an even stronger connection between incomes and carbon footprints, such as the global study whose striking results are shown in Figure 7. It showed that in the European (including the UK) and North American regions, people in the top 10% of incomes on average have around six times the footprints of those with the lowest 50% of incomes. The disparities were even greater in the Asian regions. In China, for example, the top 10% – who have benefited most from the country’s industrialisation – produced about 14 times the emissions of the bottom 50% (Chancel, 2022, p. 936).
These studies show clearly that richer people generally have a greater impact on the climate than poorer people and so arguably have a greater responsibility for reducing their footprints. Indeed, Chancel’s research shows that to meet global emissions reduction targets, rich people across the world – but especially those in the Global North – must radically reduce their footprints, while to reduce inequality, the half of the population in the poorest parts of the Global South should be allowed to increase theirs.