2.3.3 Total carbon footprints
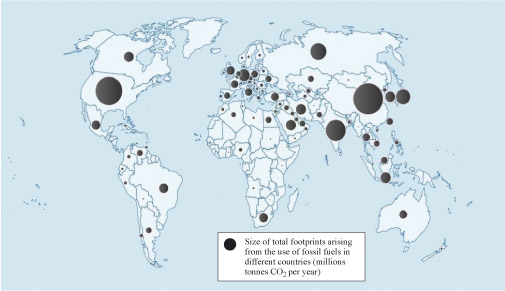
The picture of carbon footprints changes again when you consider total CO2 emissions for different countries rather than emissions per person. Table 3 shows that by 2011 China had become by far the greatest total emitter of CO2, followed by the USA and India.
| Country | Total CO2 (2011), million tonnes per year (rounded) | Total CO2 (2023 est.), million tonnes per year (rounded) |
| China | 9020 | 11397 |
| United States | 5306 | 5057 |
| India | 2074 | 2830 |
| Russian Federation | 1808 | 1652 |
| Japan | 1188 | 1054 |
| Germany | 730 | 666 |
| Saudi Arabia | 520 | 663 |
| South Africa | 477 | 404 |
| United Kingdom | 448 | 319 |
| Brazil | 439 | 483 |
| Australia | 369 | 392 |
| France | 339 | 298 |
| Turkey | 321 | 436 |
| Thailand | 303 | 271 |
| Egypt | 221 | 259 |
| Pakistan | 164 | 200 |
| Nigeria | 88.0 | 129 |
| Romania | 84.8 | 74 |
| Israel | 69.5 | 56 |
| Sweden | 52.1 | 38 |
| Ireland | 36.1 | 39 |
| Uganda | 3.8 | 6.0 |
| World total | 34 437 | 37 150 |
Footnotes
Note: the CO2 emissions shown in Tables 1 and 3 are based on from burning fossil fuels, cement manufacture and gas flaring.Figure 9 shows more of the same information updated using estimations for 2022, when China, the USA and India combined emitted half of the world’s CO2.