Skip to content
Skip to main content

About this free course

Download this course

Share this free course

The search for water on Mars

Start this free course now. Just create an account and sign in. Enrol and complete the course for a free statement of participation or digital badge if available.

Mars Odyssey

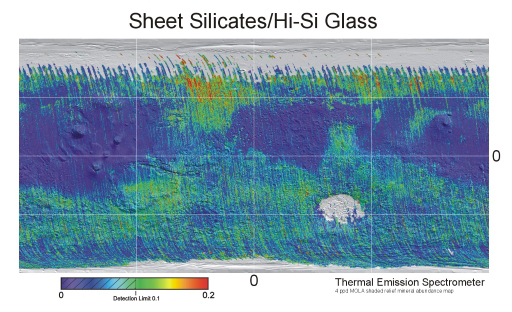
Mars Odyssey’s Thermal Emission Imaging System (THEMIS) mapped the distribution of minerals on Mars at a resolution of 100 m per pixel. This included clay minerals, which you will recall can only form if water is present. You can see a map of clay mineral distribution in Figure 25. This map is very exciting, because it can be combined with topographic maps showing stream beds and other landforms (Figure 26), to understand the types of environments in which the minerals might have formed.

This figure is a map of Mars. The map is rainbow colour coded from red to violet. Violet and blue colours represent low detection of silicates. Orange and red colours show high detection of silicates. The map is roughly divided into thirds from top to bottom (north to south). The top third is mainly grey, indicating no data was collected there. The next third (to the south) is mainly blue, showing low levels of silicates, with some green areas to the south. The next third south blue and green, indicating higher levels of silicates. The south polar region is coloured grey, indicating no data was collected there.
Figure 25 This map, based on data of the Thermal Emission Spectrometer aboard of the Odyssey orbiter, shows the location of sheet silicates - a synonym for clay minerals and silica rich glasses. Both types of minerals can only form in the presence of water. Image credit: NASA/ASU
This figure is a map of Mars. It is rainbow colour coded according from red to violet. Violet and blue areas represent low levels of subsurface water. Red areas represent high levels of subsurface water. The north and south pole, and a band across the middle of the map are grey, representing no data collected there. The sub-polar areas are violet and blue colours. Mid-latitude areas, particularly in the northern hemisphere are green to red colours.
Figure 26 The map from Figure 25 is combined with data from the Mars Reconnaissance and Mars Global Surveyor orbiters. This shows the location of water ice beneath the surface of Mars. Image credit: NASA/JPL-Caltech/ASU.

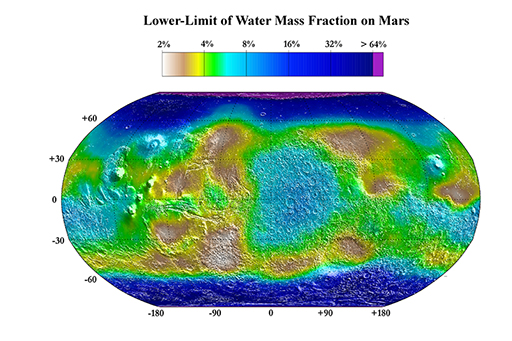
In addition to THEMIS, Mars Odyssey also carries a Gamma Ray Spectroscope (GRS). This can detect gamma radiation produced when cosmic rays from space interact with elements in the rocks and soils on Mars. In particular, it can detect hydrogen, which in significant quantities could indicate the presence of water ice. Figure 27 shows that the GRS found high amounts of hydrogen at polar latitudes (dark blues and purples), but lower amounts distributed across the planet.

This figure is a map of Mars. It is colour coded from white, through browns, green, blue and violet. The colours are overlain onto a topographic map of Mars. Violet represents the highest amounts of water in the upper metre of the martian surface. White represents the lowest amounts of water in the upper metre of the martian surface. The martian poles are coloured dark blue. The remainder of the map is coloured light blue to brown. There is no obvious correlation with topography.
Figure 27 This map is the result of the GRS investigations of the martian surface and is based on the observation of hydrogen in the upper metre of the surface. Image credit: NASA/JPL/Los Alamos National Laboratory.