Skip to content
Skip to main content

About this free course

Download this course

Share this free course

The search for water on Mars

Start this free course now. Just create an account and sign in. Enrol and complete the course for a free statement of participation or digital badge if available.

4.7 Mars Reconnaissance Orbiter

In 2005, NASA sent its most powerful orbiter (even to date, 2021) to Mars. The Mars Reconnaissance Orbiter (MRO) is equipped with a number of instruments with which to image the surface, determine its mineralogy and even investigate the subsurface.

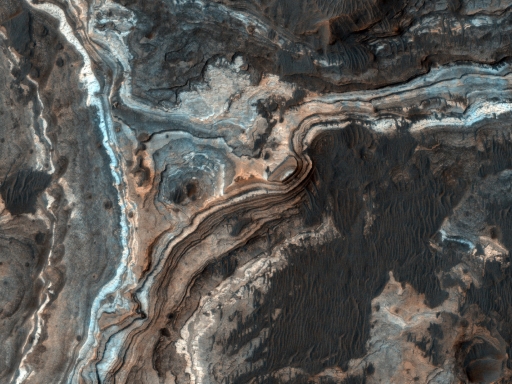
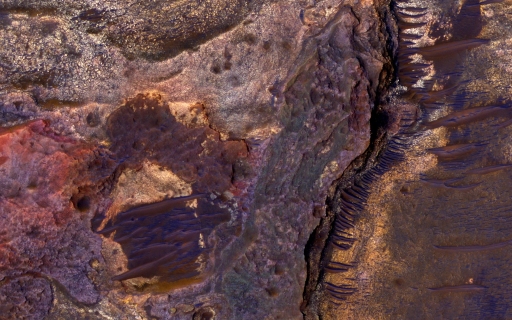
Figure 37 shows a stunning example of an image taken by MRO’s High Resolution Imaging Science Experiment (HiRISE), capable of imaging the surface of Mars at 30 cm per pixel. It shows horizontal layers or beds that are probably sedimentary rocks deposited in a standing body of water. These beds also appear to be disrupted, possibly by episodic flooding. Sedimentary beds can also be seen on Figure 38, which shows the floor of the Ebersawalde impact crater, further evidence of significant bodies of liquid water in Mars’ past.

This figure is a photograph taken from Mars orbit. The main feature is a series of parallel, wavy lines representing a channel, that that track upwards from the bottom of the image to roughly the middle of the image. In the middle there is a roughly circular feature. Further channels extend from that feature upwards and to the right. The centre of the channels are coloured blue, and the outer edges are greys and browns. All other areas are darker grey colours and varying shades.
Figure 37 HiRISE image taken of Ladon Vallis, a 600 km-long outflow channel extending from a basin in the south to the north of Mars. The light-toned layers contrast with the darker-toned deposit on the floor of the channel, with dark toned dunes partly filling fractures and impact craters. Credit: NASA/JPL-Caltech/University of Arizona.
This figure is a photograph taken from Mars orbit. The main feature is a ridge extending north to south on the right hand side of the image. To the right of this ridge, dark brown horizontal lines are shown, surrounded by purple and brown material. To the left of this ridge are complex shapes with different textures and colours.
Figure 38 HiRISE image of the floor of an impact crater north of Ebersawalde crater. Credit: NASA/JPL-Caltech/University of Arizona.

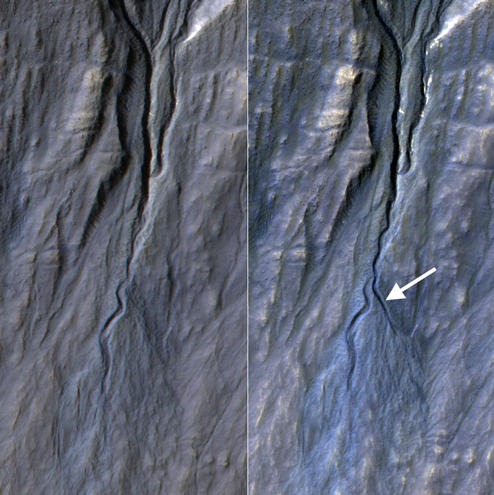
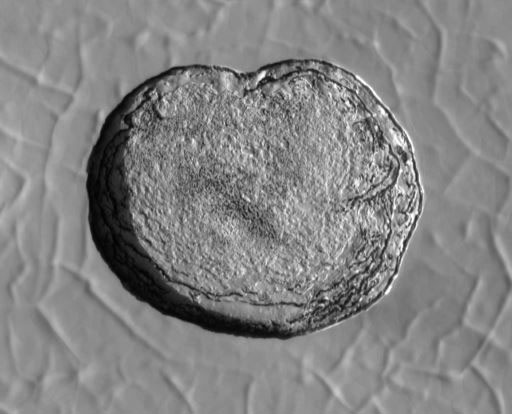
HiRISE has also identified processes that are happening now on Mars. Figure 39 shows two images taken three years apart. Comparing these, you can see a new channel (labelled with an arrow) on the more recent, right-hand image that is absent in the older image. This means a process is operating now on the martian surface that can produce features such as this. Although at first this was thought to be a process involving water, it is now believed to be formed by the sublimation of carbon dioxide frost over the martian winter. Similar processes are thought to be responsible for other surface features (e.g., Figure 40), but this shows that geomorphology is not always a reliable tool with which to look for water.

This figure consists of two photographs of the same area of Mars side by side. Both show a v-shaped channel at the top with a single channel extending from the point of the v, downwards towards the bottom of the image. On the right hand image, a second channel is evident, branching off in a different direction from the original channel.
Figure 39 Pair of HiRISE images taken in 2010 (left) and 2013 (right), showing a new channel, as indicated by the white arrow, formed by seasonal variation in carbon dioxide frost. Other HiRISE observations have indicated that these processes typically occur gradually in winter. Credit: NASA/JPL-Caltech/Univ. of Arizona.
Download this video clip.Video player: Figure 40
This figure is an animation using photographs taken of the south pole of Mars from Mars orbit over several years. The images are grey scale. The image shows a roughly circular ice cap. The animation shows this growing in size over time.
Figure 40 Animation of a series of images acquired by HiRISE between 2007 and 2013. The animation shows the transition of carbon dioxide from ice to gas (sublimation) at the south pole of Mars. As the ice sublimates from the walls of the pit it reforms on nearby flat surfaces. Credit: NASA/JPL-Caltech/University of Arizona.
Interactive feature not available in single page view (see it in standard view).

MRO has two other instruments important to the search for water. The CRISM (Compact Reconnaissance Imaging Spectrometer for Mars) instrument can detect minerals on the martian surface at a resolution of 18 m per pixel. Consistent with previous spacecraft, it has found widespread clay minerals, but has also identified sulfates and carbonates. These were previously unseen by lower resolution orbiting instruments but had been identified by spacecraft on the martian surface. Figure 41 shows a false-colour image created using CRISM data to highlight the distribution of certain minerals in Jezero crater. These data were key in selecting this crater as the landing site for the NASA Perseverance rover, which you will hear more about later.

This figure is a greyscale image of the surface of Mars showing a circular impact crater. This is overlain with coloured panels in some areas. The colours range from red to blue, with reds and pinks mainly around the outside of the impact crater, and greens and blues inside the crater.
Figure 41 Topographic image with CRISM false-colour imagery overlain. Green suggests carbonate minerals (formed by water) and red indicates olivine sand. Credit: NASA/JPL-Caltech/MSSS/JHU-APl/Purdue/USGS.

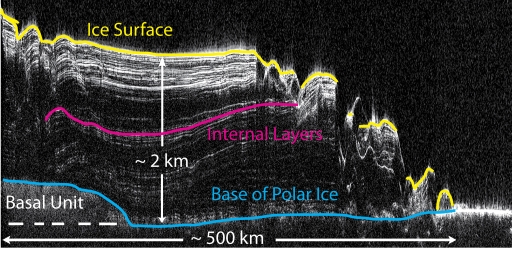
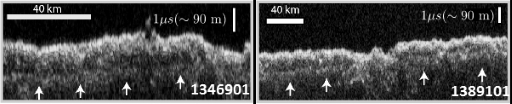
MRO also carries SHARAD (SHAllow RADar sounder), a radar instrument, like MARSIS on Mars Express. This has found that the ice at the north pole is around 2 km thick and has internal layers (Figure 42), but it has also found ice at other areas of Mars, located approximately 90 m below the surface (Figure 43).

This figure is a radar profile. It shows wavy white lines on a black background. The white lines represent layers of ice underneath the surface. The lines are roughly parallel and run horizontal in the left hand side of the image. Here, there are many tightly packed white lines at the top of the image, which is labelled ice surface. A third down the image the lines are less frequent, labelled internal layers, and at the bottom they are not well defined but are labelled base of polar ice and basal unit. To the right hand side of the image the lines are uneven, broken and slope downwards, representing the edge of the icecap. They still follow the same pattern as the left hand side of the image.
Figure 42 SHARAD radar cross section of the north polar cap of Mars You can see an internal ice structure with the white lines representing radar reflections due to layers/boundaries. Credit: NASA/JPL-Caltech/ASI/UT.
This figure shows two radar profiles, side by side. Each image is represents an area approximately 100km across, from left to right. The bottom of each image has white, mottled shading on a black background. The top of the mottled area, on both images, is a wavy line that extends across the centre of the image from left to right. Each image shows white arrows pointing upwards towards areas where the white shading is more concentrated.
Figure 43 SHARAD radargram showing subsurface water ice in Utopia Planitia region of Mars. The white arrows indicate subsurface reflections caused by the subsurface water ice. Credit: NASA/JPL-Caltech/Univ. of Rome/ASI/PSI.