

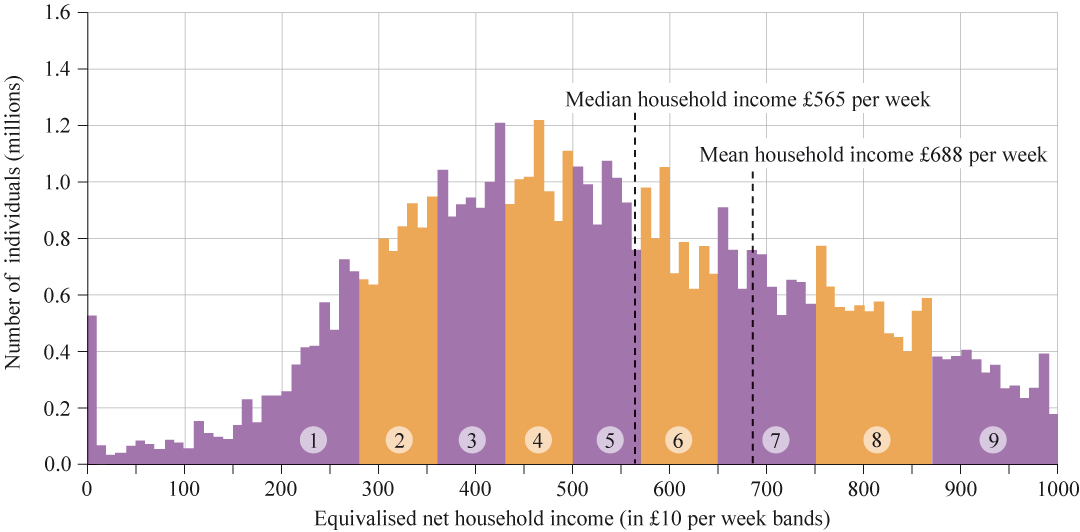
Figure 6 Distribution of the UK population by household incomes in 2021–22. Group 1 is the distribution of household incomes for the 10% of individuals living in the poorest households. Group 9 is the household incomes for the 10% of individuals living in the richest households (excluding 8.8 million individuals with a household income above £1000 per week). Equivalised means the incomes are adjusted to take account of the numbers of adults and children in a household (adapted from DWP, 2023).