4.3.3 Getting at the activation energy
The final trick I want to show you with Arrhenius's law is how to extract the constants r0 and Ea from experimental data. If the Arrhenius equation (Section 4.3.1) is 'turned inside out' by taking natural logarithms of both sides it becomes:
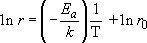
Comparing the logarithmic equation with the standard equation for a straight line,

you can probably see how to get a straight line – if the Arrhenius model is valid, ln r (for y) against 1/T (for x) is what should be plotted.
How do you get the values of r0 and Ea from such a graph?
r 0 comes from the intercept at 1/T=0 and −E a/k is the gradient (or slope) m.
Box 11 Using Arrhenius plots shows how to do this.
Box 11 Using Arrhenius plots
I'm going to describe an epoxy glue, which I'll call TickyTacky. It comes as two tubes of paste that are to be mixed together in equal proportions, and it is cured by heat. The manufacturer's notes say that, once mixed, TickyTacky can be stored in a freezer for several days and that it sets after 6 minutes at 142 °C, 10 minutes at 127 °C, or 30 minutes at 100 °C. That is sufficient data for an Arrhenius plot to be drawn. The rate of reaction is the reciprocal of the setting time, and temperatures need to be in kelvin. Table 5 converts the data to the appropriate form and Figure 21 (a) is the corresponding graph.
| Temperature, T | Curing time | Reaction rate, r | T −1 /K−1 | ln r | |
|---|---|---|---|---|---|
| / °C | / K | / min | / min−1 | ||
| 142 | 415 | 6 | 0.17 | 0.00241 | −1.8 |
| 127 | 400 | 10 | 0.10 | 0.00250 | −2.3 |
| 100 | 373 | 30 | 0.033 | 0.00268 | −3.4 |
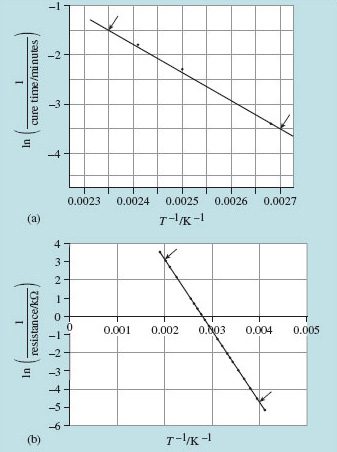
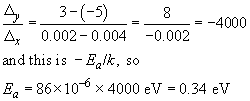
To find the activation energy for the curing reaction we must calculate the gradient of this logarithmic line. Using the arrowed points in Figure 21(a),
The graph shows a typical awkward feature. Because measurements are over a narrow range of T, and the T−1 axis is very stretched, the intercept at T−1 = 0 is not immediately readable. We need to proceed by calculation instead, taking the data for T = 400 K (that is, T−1 = 2.50 − 10−3 K−1) and ln r = −2.30,
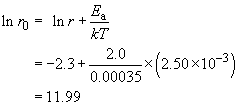
So r0 is e11.99, which is approximately 160 000 min−1.
SAQ 6
(a) You can estimate a shelf-life for the glue 'TickyTacky' by seeing what the curing time would be for room temperature, based on an extrapolation of the Arrhenius plot (Figure 21a), or by substitution into the above equation; I found the curing time for 20 °C to be 2000 minutes, which is almost 1.5 days. Check this value for yourself and investigate if storage in a deep freeze at −15 °C is worthwhile.
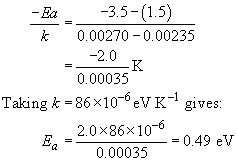
(b) The temperature-dependent conductance of a thermistor was shown in Figure 20. It is plotted again in Figure 21(b) as an Arrhenius plot of ln(1/resistance) against 1/T. From the gradient of the line, determine the activation energy for thermally induced conductivity in the material of the thermistor.
Answer
(a) You need to go as far as T −1 = 0.00341 for 20 °C and 0.00388 for −15 °C. From that it appears that the straight-line extrapolation passes through ln r = −7.6 and −10.2, respectively. To find the reaction rate we need to take exp(ln r).
Curing times follow from the reciprocal of the rates: 1950 minutes (1.3 days) and 27000 minutes (19 days). Storage in a deep freeze at −15 °C is worthwhile for a week or so, after which time the paste will have become unworkable. Table 6 summarises.
| Temperature, T | Curing time | Reaction rate, r | T–1 I K–1 | ln r | |
|---|---|---|---|---|---|
| °C | K | / min | / min−1 | ||
| 20 | 293 | 1950 | 0.0005 | 0.00341 | −7.6 |
| −15 | 25 | 27000 | 0.000037 | 0.00388 | −10.2 |
(b) The gradient of the straight line in the Arrhenius plot of Figure 21(b) is