
3.2 – Specific Heat Capacity calculations
Ideally you will have done the specific heat capacity experiment as part of the face-to-face sessions.
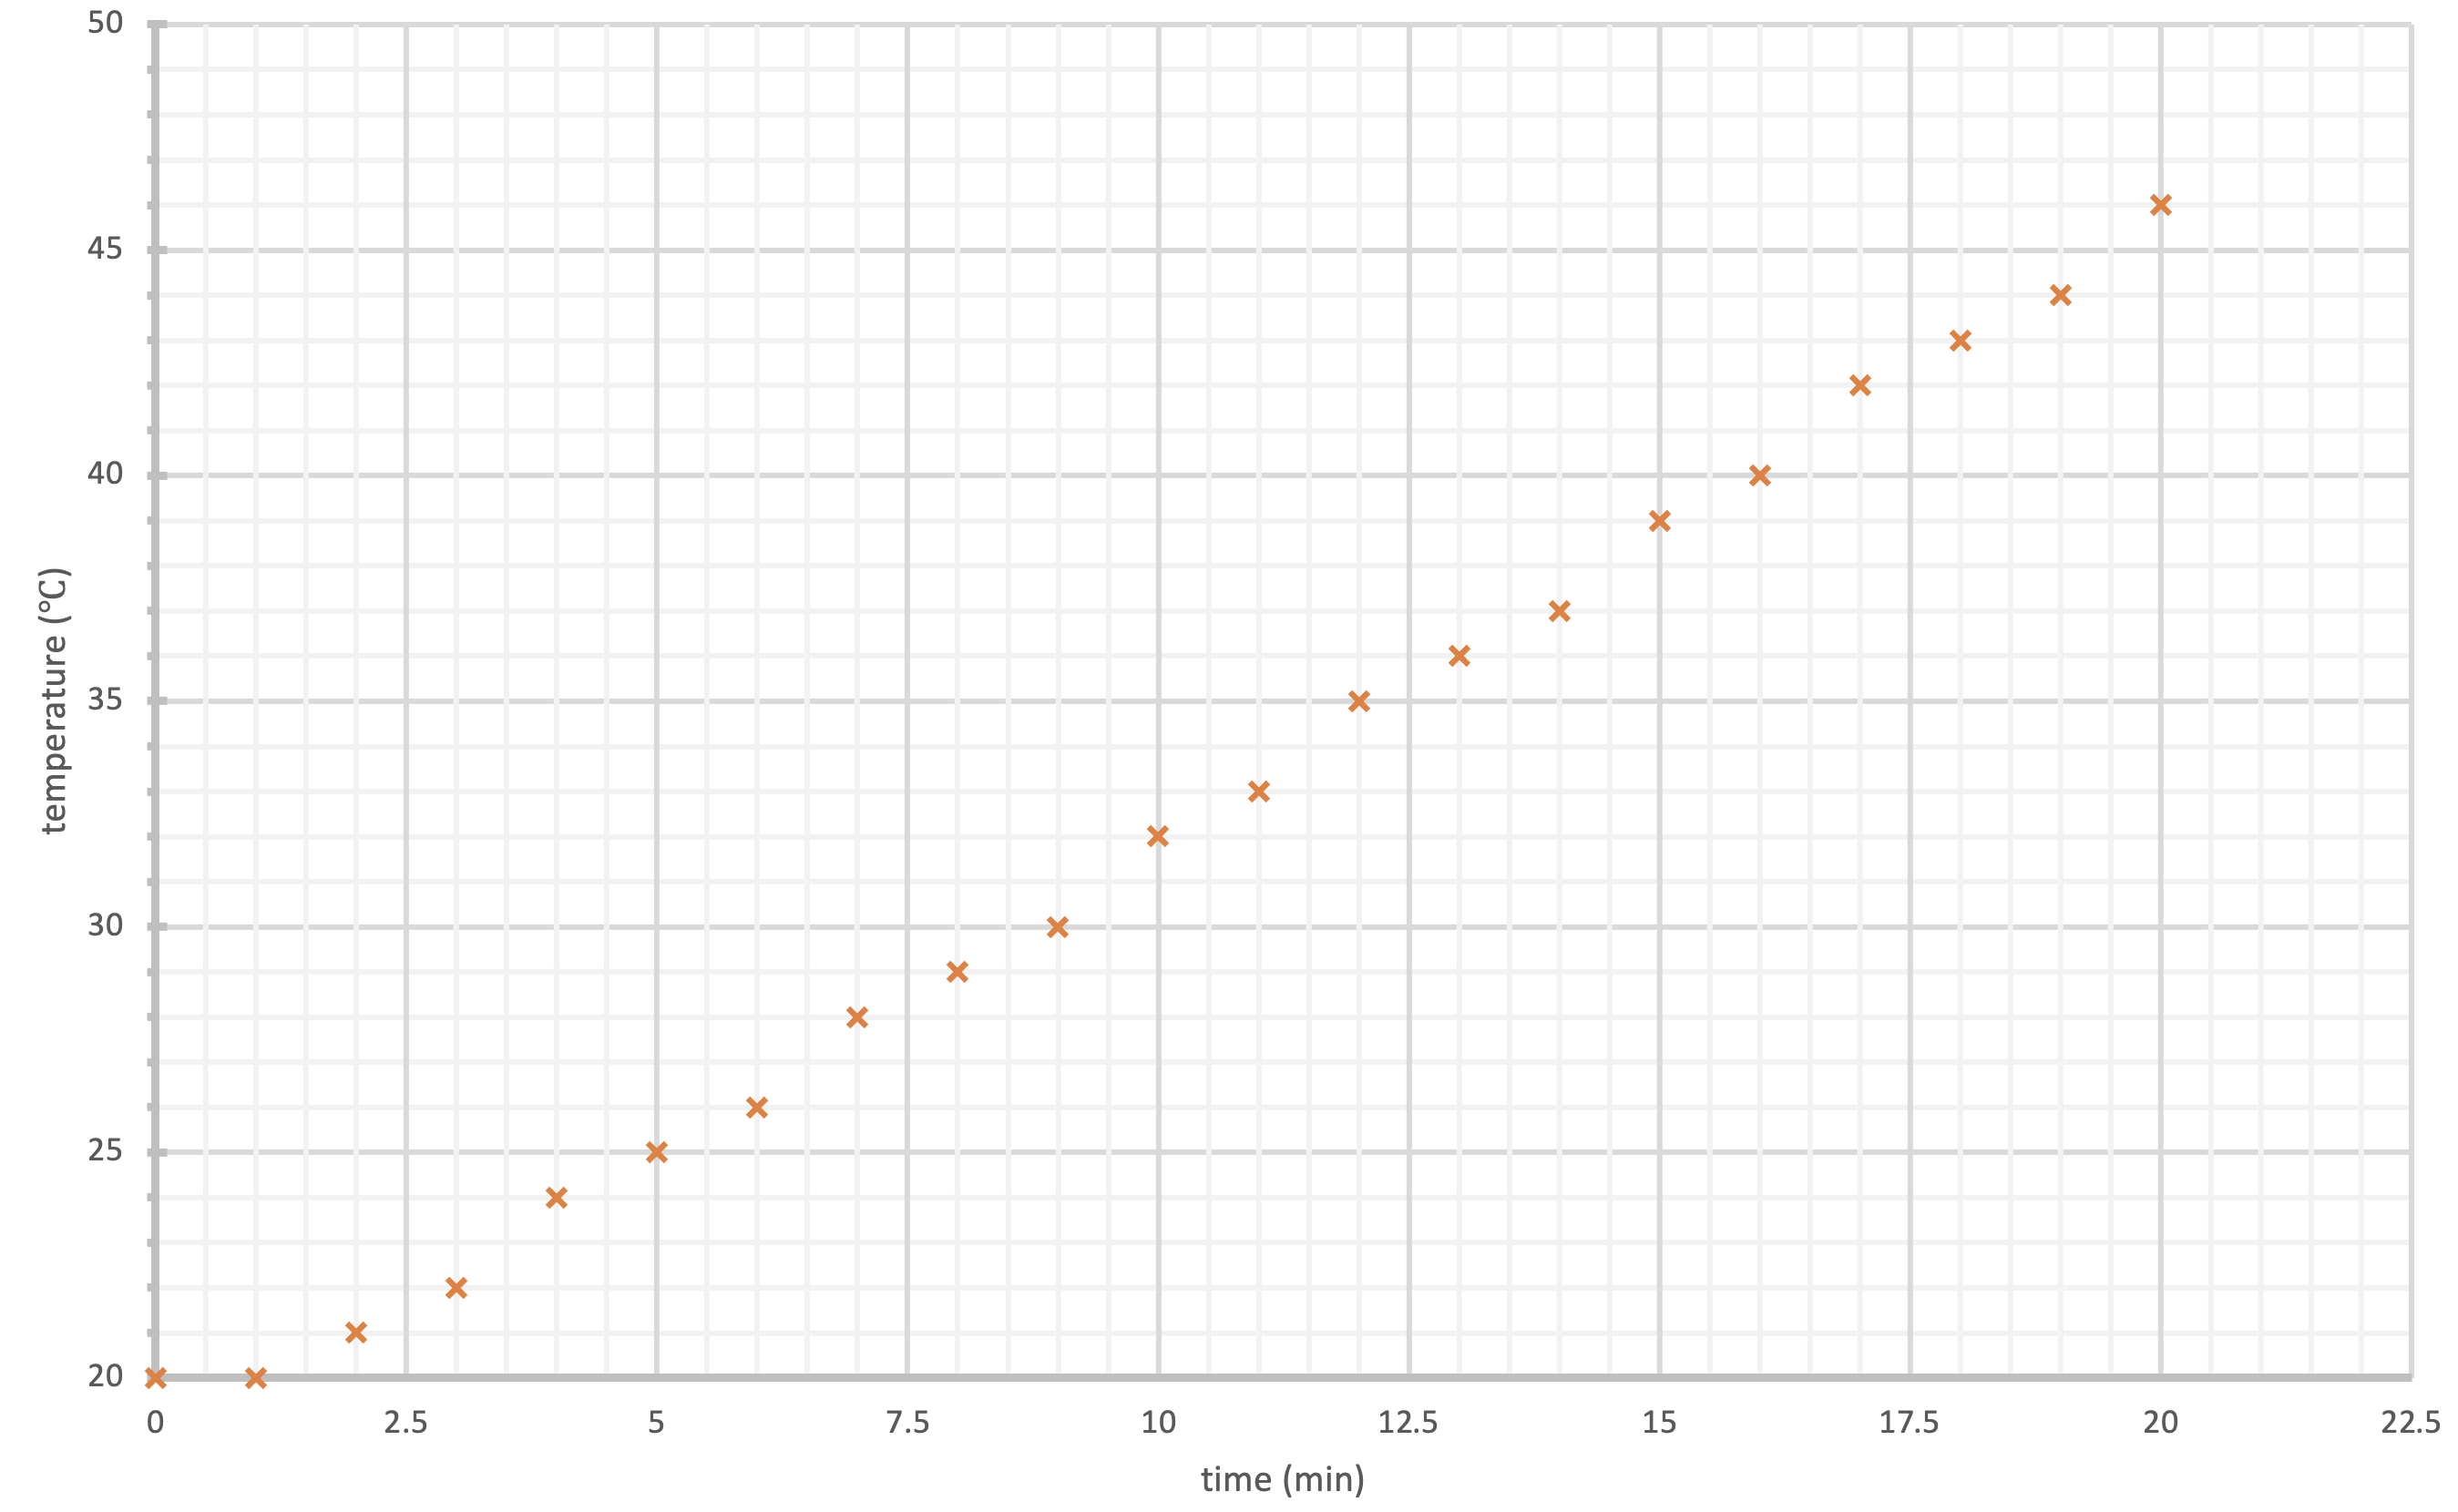
We’re going to take some data from that experiment, plot it and use it to calculate a value for the specific heat capacity of water. You will then be asked to reflect on why we use graphs and share some top tips for teaching graphs to students.
There is also a printable worksheet that includes this information.
Follow these instructions to determine the specific heat capacity. These instructions are designed to help students to get a value that is as accurate as possible. If you get stuck, the video below shows how to do it (but it should be attempted first).
Plot a line of best fit- Draw the line of best fit. Hint - it will not pass through the origin; you should ignore the first part of this graph.
- Draw a vertical line at the left-most thick line (). Hint – do not use the plotted crosses; use the line you have drawn.
- Draw a vertical line at the right-most thick line ()
- Draw horizontal lines from where these have crossed.
- Work out the temperature change between and .
- Work out how much energy was drawn by the electrical heater in using and
Determine the specific heat capacity
- This energy will have heated up the block.
- Use this to determine the specific heat capacity of water
- Compare your answer with the theoretical answer of
Once you have completed the task and have a value for the specific heat capacity, watch this short video where Alan explains some of his top tips on why we use graphs, and some shortcuts to help teach these skills.
Alan’s graph scales ruler is attached here. It should be printed double-sided on A4 card.
If you know of any good tips that you can share with others about plotting graphs, please add information to the forum (this will be viewable by all participants – please do not include anything you do not own the copyright for).
3.1e – Internal energy