

5 The contemporary Arctic climate
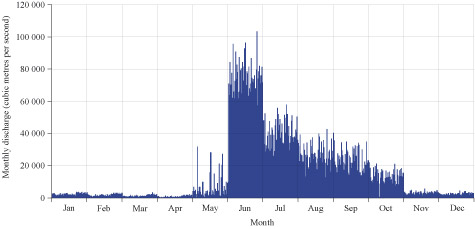
There is a remarkable seasonality in the Arctic climate. For example, the flow in some of the great rivers of Russia and North America that empty into the Arctic Ocean almost stops in winter (Figure 25). During May, ice in the rivers starts to break, and in June there is a rapid flood of fresh water followed by a fall in flow until November, when it freezes.
A similar huge seasonal signal is seen in the Arctic sea ice cover (Figure 22). Most people are surprised to realise that the sea ice of the frozen Arctic Ocean is only a few metres thick. Beneath this are a few kilometres of water. In winter as much as 16 million square kilometres of the ocean freezes, and as this melts in summer, only about 6 million square kilometres remains frozen. The seasonal variation of almost 10 million square kilometres is equivalent to about 45 times the area of the United Kingdom.
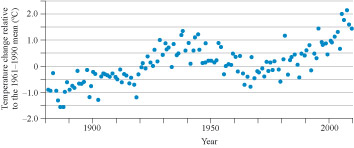
The contemporary Arctic climate appears to be changing. However, average global temperatures mask regional variations and the Arctic has been warming faster than the global mean (Figure 26).
Activity 11 Recent climate change in the Arctic
Describe the changes in Arctic temperature that are shown in Figure 26.
Discussion
With the exception of a period in the 1960s and 1970s, the Arctic land temperature has been above the 1961–90 average in most years since 1920 and reached 2 °C above the 1961–90 average in the early part of the 21st century. These data came from the Arctic Monitoring and Assessment Programme. They appear to use the latitude of 60° N as their definition of the Arctic, so Figure 26 must include meteorological stations that are not in the Arctic as it has been defined in the course, which are less likely to be affected directly by changing ice and snow cover. For this reason, Figure 26 most likely underestimates the land temperature increase.
Next you will look at the impact of land temperature increases.