4.1 Wally Broecker’s great ocean conveyor belt
The density of fresh water decreases as its temperature rises above 4 °C. The density of salt water in the oceans likewise depends on temperature, but also on the amount of salt within it; saltier water is more dense.
In the seas of the North Atlantic Ocean the surface waters are cooler and therefore denser than the lower layers. In places like the central Pacific Ocean the relatively dry, warm air increases evaporation and the surface waters are both warm and salty. All around the planet different regional climatic conditions create surface waters with different densities.
Because denser waters sink, over time horizontal currents are set up similar to the processes for the winds. The result is a vast, three-dimensional circulation across the entire ocean. In the 1980s, the American climate scientist Wallace Broecker suggested that the global ocean circulation could be viewed as analogous to a conveyor belt that moved heat and salt around the planet. Broecker’s schematic picture (Figure 21) has become one of the iconic images of climate science.
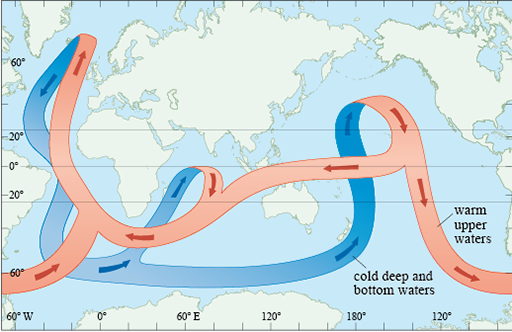
It is a huge simplification, but on a global scale Broecker’s conveyor belt is excellent at helping to understand planetary processes such as the Younger Dryas and the 8.2 ka event.
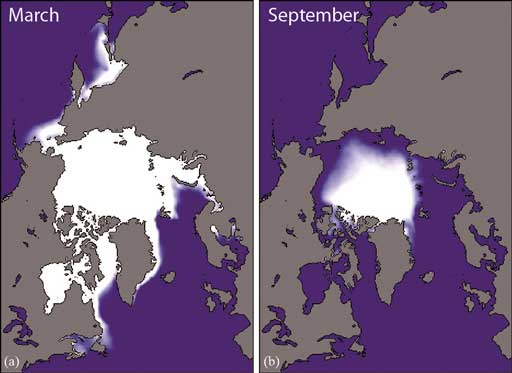
Heat that is carried in the ocean conveyor past Britain and up the coast of Norway towards Svalbard keeps the UK climate warmer and moister than it would otherwise be and means that the ice edge is a long way north compared with similar latitudes in North America, all year round (Figure 22).