3.1 Ice cores and the atmosphere
Analysis of ice cores collected in the Polar Regions can also tell us about how the climate has changed. Watch Video 4 which shows how scientists extract cores from the ice sheets and then saw them up for analysis in a laboratory.
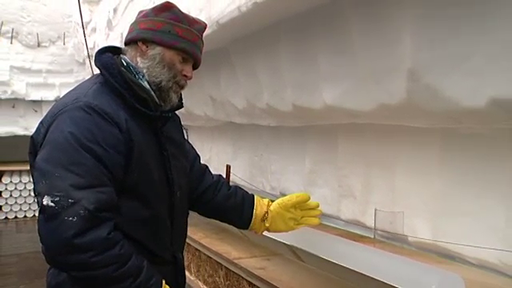
Transcript: Video 4 Ice core drilling
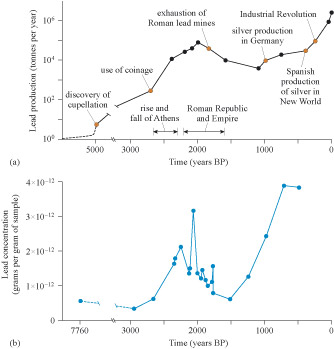
In addition to looking at snowfall, the use of different chemical and physical techniques to analyse ice cores can tell you about dust and pollen in the atmosphere, past volcanic activity, and even the industrial production of civilisations long past. For example, Figure 11 shows the concentrations of lead in the ice of different ages, and compares it with the recorded production of lead starting with the discovery of ‘cupellation’ (separating precious metals like silver from base metals like lead).
Notice that the vertical axis of the lead production graph in Figure 11(a) is a logarithmic scale. Each successive tick mark up the axis has a value ten times bigger than the previous one. For example, 100 is equal to 1, 102 is equal to 100, and the tick mark between them is 101 (i.e. 10). A logarithmic axis enables changes over a large range to be compressed onto a small scale.