
Start this free course now. Just create an account and sign in. Enrol and complete the course for a free statement of participation or digital badge if available.
Look at Figure 6 and answer the following question.
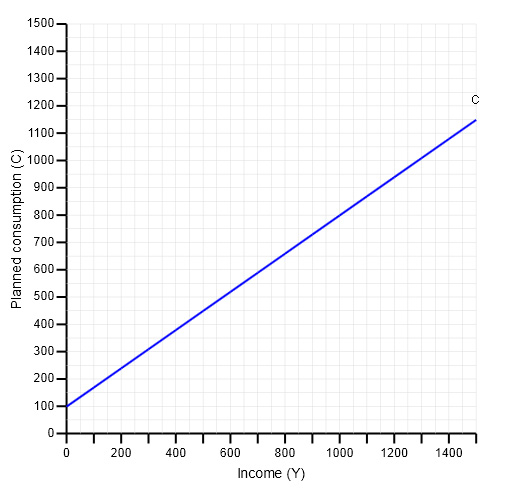
Figure 6 A more realistic consumption function
Show description|Hide description
The diagram shows a consumption function, labelled as C.
The vertical axis is labelled as ‘Planned consumption (C))’ and has values from 0 to 1500, at intervals of 100. The horizontal axis is labelled as ‘Income (Y)’ and has values from 0 to 1500, at intervals of 100.
The consumption function is a straight line that slopes upwards, starting from point 100 on the vertical axis. The upward slope is fairly steep but less than 45 degrees. The end point of the function on the diagram is at Y of 1500 and C of 1150. Coordinates of points the consumption function passes through include, for example, (500Y,450C) and (1000Y, 800C).
Figure 6 A more realistic consumption function
What is the equation of this revised consumption function?
To use this interactive functionality a free OU account is required. Sign in or register.