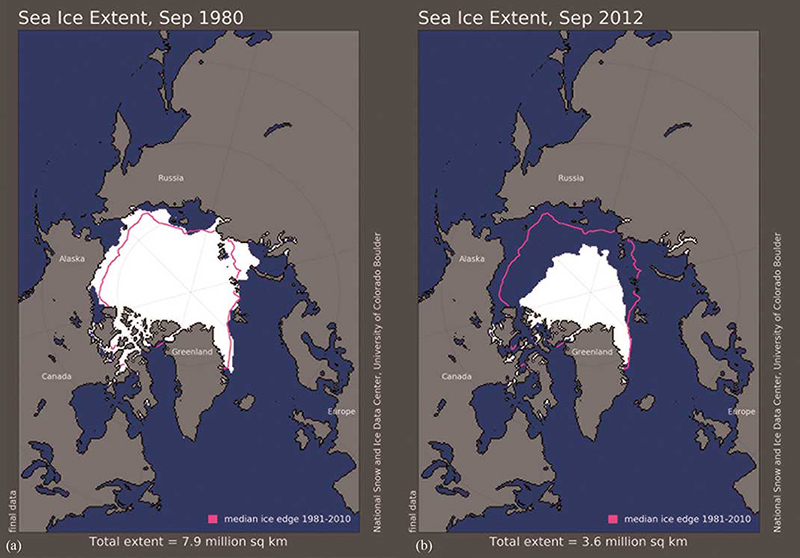
Figure 29 Arctic sea ice extent in September: (a) 1980; (b) 2012. These years have been selected to show the largest observed changes. The median September sea ice extent from 1981–2010 is shown as a pink line.

Personalise your OpenLearn profile, save your favourite content and get recognition for your learning

Start this free course now. Just create an account and sign in. Enrol and complete the course for a free statement of participation or digital badge if available.