
Active galaxies
Figure 10 shows the spectral energy distribution of an active galaxy.
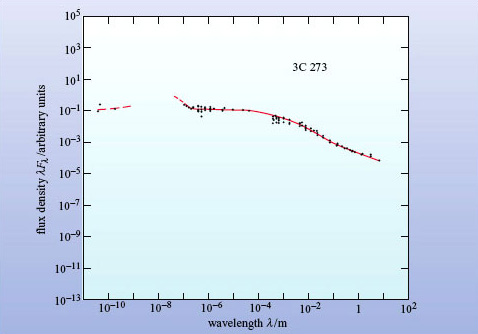
In broad terms, what is the major difference between the SED of the normal galaxy in Figure 9 and the SED of the active galaxy in Figure 10?
Compared with the (unquantified) peak emission, the SED of the active galaxy is much flatter than that of the normal spiral galaxy. This indicates that there is relatively much more emission (by several orders of magnitude) at X-ray wavelengths and at radio wavelengths.
For the active galaxy (known from its catalogue number as 3C 273) the peak emission is in the X-ray and ultraviolet regions. Many other active galaxies are bright in this region and the feature is known as the 'big blue bump'. In some active galaxies, though not this one, the infrared emission is prominent. These galaxies emit a normal amount of starlight in the optical, so they must emit several times this amount of energy at infrared and other wavelengths - this is another feature that distinguishes active galaxies from normal galaxies. It means that we have to account for several times the total energy output of a normal galaxy, and possibly a great deal more. A normal galaxy contains 1010 to 1011 stars, so we need an even more powerful energy source for active galaxies.
The term spectral excess is used (rather loosely) to refer to the prominence of infrared or other wavelength regions in the broadband spectra of active galaxies. In particular, it is often used to indicate the presence of emission in a certain wavelength region that is over and above that which would be expected from the stellar content of a galaxy.
Question 5
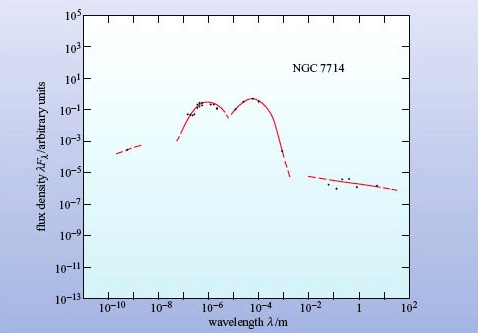
Now that you have some experience in interpreting the spectra of galaxies, look at the SED of the galaxy NGC 7714 in Figure 11. Describe as fully as you can what the diagram tells you about this galaxy. Can you guess what sort of galaxy it is?
Answer
The spectrum shows two distinct peaks, one at the red end of the optical (similar to a normal galaxy) and one far into the infrared, near 100 μm. The far-infrared peak is at a similar wavelength to the small peak in a normal spiral galaxy, but it is higher than the optical peak, suggesting that this galaxy emits most of its energy in the far-infrared. There is no significant emission in the UV or X-ray region.
This is not a normal galaxy and you might have guessed that it is an active galaxy. In fact, it is a starburst galaxy. The infrared radiation is coming from dust heated by the continuing star formation and is another distinguishing characteristic of a starburst galaxy, in addition to the strong narrow optical emission lines that you encountered earlier.