

5.4 The mode
The USA workforce data in Table 2 were usefully summarised in Figure 6, which is reproduced below as Figure 18.
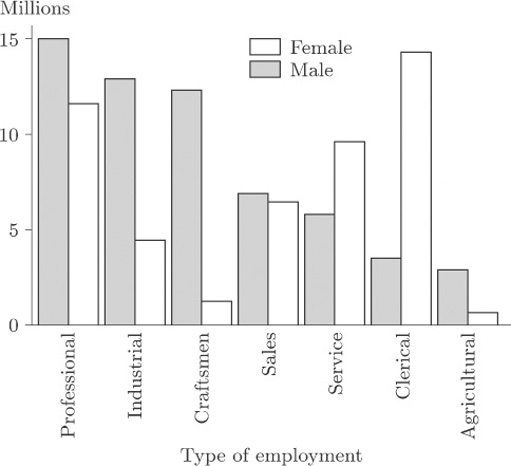
The variable recorded here is ‘type of employment’ (professional, industrial, clerical, and so on) so the data are categorical and not amenable to ordering. In this context the notion of ‘mean type of employment’ or ‘median type of employment’ is not a sensible one. For any data set, a third representative measure which is sometimes used is the mode. It describes the most frequently occurring observation. Thus, for males in employment in the USA during 1986, the modal type of employment was ‘professional’ while, for females, the modal type of employment was ‘clerical’.
The word mode can also reasonably be applied to numerical data, referring again to the most frequently occurring observation. But there is a problem of definition. For the birth weight data in Table 3, there were two duplicates: two of the infants weighed 1.72 kg, and another two weighed 2.20 kg. So there would appear to be two modes, and yet to report either one of them as a representative weight is to make a great deal of an arithmetic accident. If the data are classified into groups, then you can see from Figures 10 to 12 in section 3.1 that even the definition of a ‘modal group’ will depend on the definition of borderlines (and on what to do with borderline cases). The number of histogram peaks as well as their locations can alter.
Yet it often happens that a collection of data presents a very clear picture of an underlying pattern, and one which would be robust against changes in group definition. In such a case it is common to identify as modes not just the most frequently occurring observation (the highest peak) but every peak. Here are two examples.