Try some yourself
Question 1
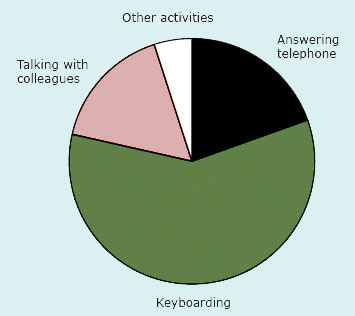
A company carried out a survey, recording how staff in a particular office spent their working time. The table shows the average number of minutes spent in each hour on various activities.
| Activity | Time taken on average in one hour/mins |
|---|---|
| Keyboarding | 35 |
| Answering telephone | 12 |
| Talking with colleagues | 10 |
| Other | 3 |
The data is to be displayed as a pie chart. Work out the angle at the centre for each slice.
Answer
Since one hour will be represented by 360° on the pie chart, 1 minute will be represented by 360° ÷ 60 = 6°.
So the required angles on the chart are:
| Keyboarding | 35 × 6° = 210° |
| Answering telephone | 12 × 6° = 72° |
| Talking with colleagues | 10 × 6° = 60° |
| Other activities | 3 × 6° = 18° |
Check: 210° + 72° + 60° + 18° = 360°.